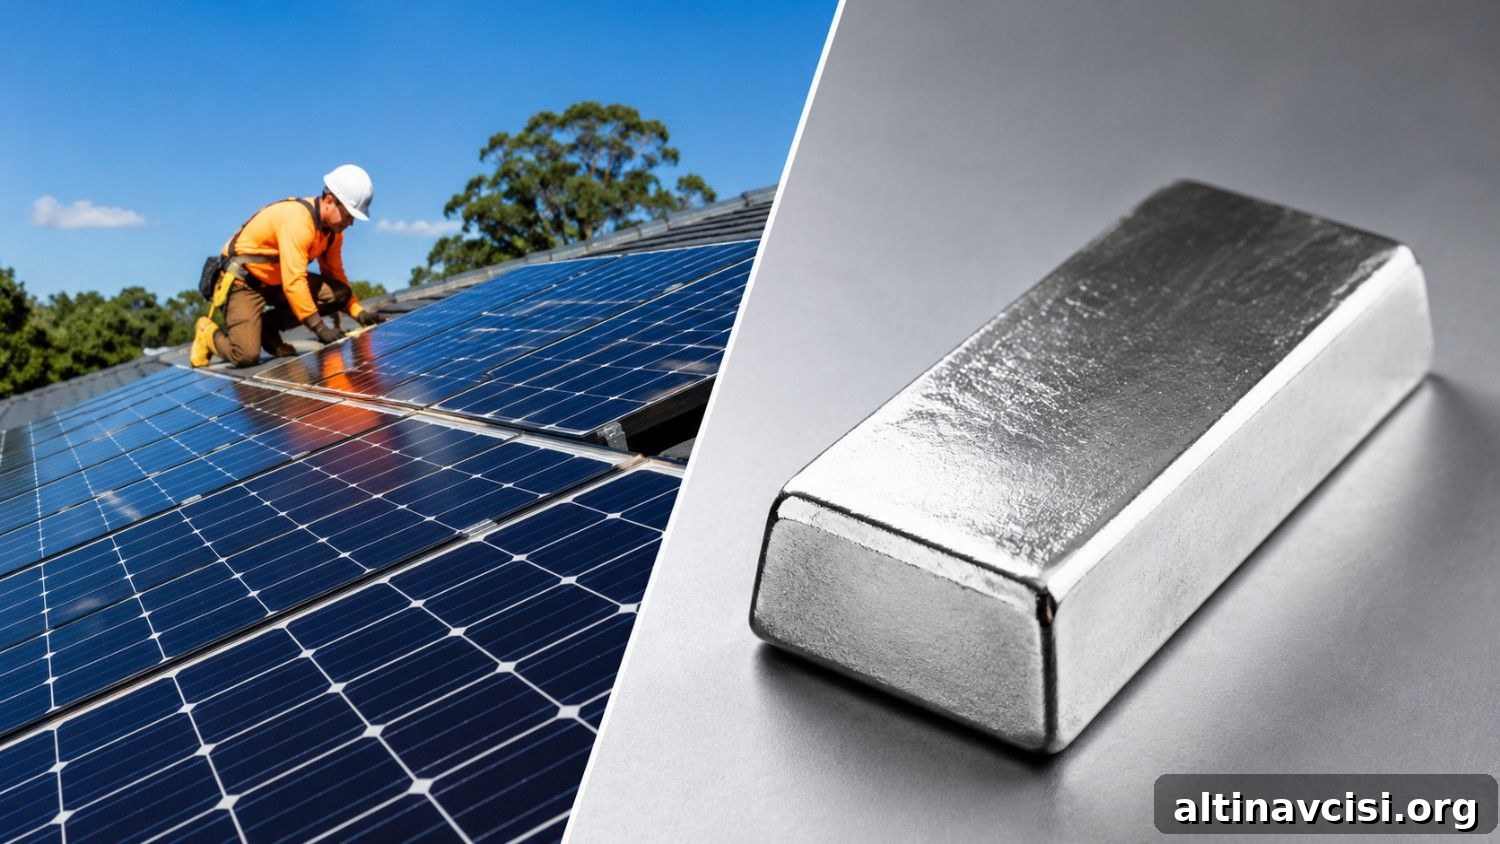
Silver is unique among major financial assets because a large portion of what is mined is consumed by industry. Roughly 58% of every ounce produced goes directly into solar panels, semiconductors, and electric vehicle motors before investors ever see it. This industrial demand profile is the strongest long-term argument for silver’s value.
That same structure also explains why silver often underperforms gold during periods of rising interest-rate expectations. On Monday, July 13, silver closed at $57.59, down 3.8% for the day, while gold finished at $3,999, down 2.9% and briefly trading below the psychologically important $4,000 level intraday.
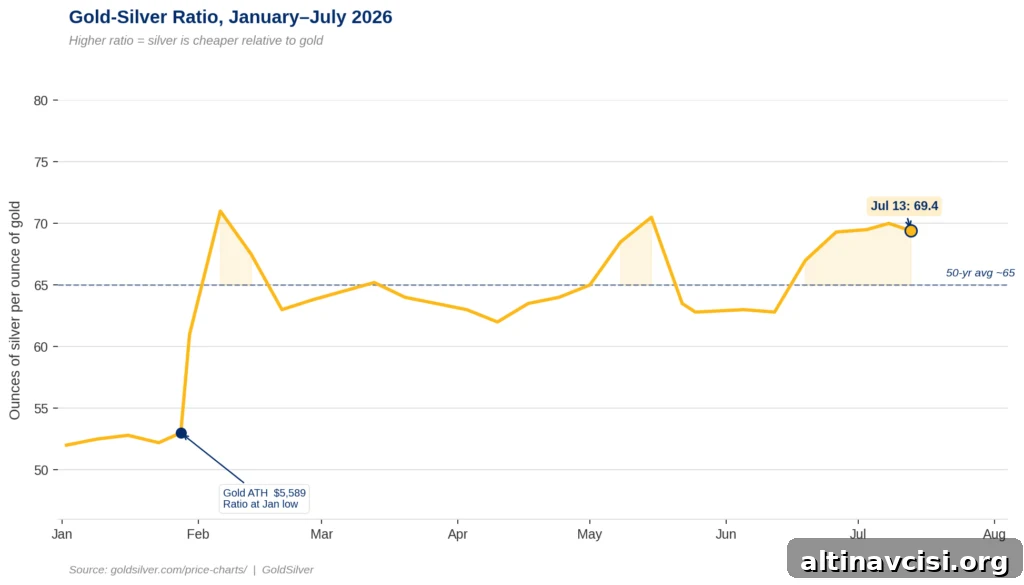
The divergence left the gold-silver ratio at 69.4—meaning it now takes nearly 70 ounces of silver to buy one ounce of gold. For context, the fifty-year average of the ratio is roughly 65.
Why did silver fall more than gold today?
A fresh bout of geopolitical tension overnight—clashes involving US and Iranian forces and reports that Tehran had closed the Strait of Hormuz—sent oil prices higher by more than 4%. Even though some official claims were disputed, the market reaction was enough to lift inflation expectations.
Higher expected inflation increases the likelihood of tighter Federal Reserve policy. Markets are currently pricing roughly a 70% chance of a September rate hike, according to CME FedWatch. That shift in expected policy affects silver in two ways at once.
How does silver’s dual-engine structure work?
Silver operates on two demand engines: monetary and industrial. On the monetary side, silver reacts to real interest rates similarly to gold—when real yields rise, holding non-yielding metals becomes more costly. On the industrial side, silver is a critical raw material for technologies like solar panels, EV motors, and certain medical devices. When the Fed signals higher rates for longer, industrial buyers may scale back purchases in anticipation of slower economic growth.
Gold, by contrast, is driven primarily by the monetary channel; it has minimal industrial use. Silver therefore feels the monetary headwind that hits gold plus an extra industrial drag. That combination amplifies moves both down and up: silver tends to fall more sharply in hawkish environments but also historically rebounds faster and stronger when conditions improve. For example, after the March 2020 low when the ratio reached 127:1, silver outperformed gold substantially over the following year.
What are central banks doing while silver falls?
Short-term downward pressure on silver is real, but central-bank behavior highlights a different, longer-term narrative. In June 2026, China’s central bank added nearly 15 tonnes of gold to its reserves—the largest single-month purchase since October 2023—extending a multi-month accumulation trend. Total Chinese official gold holdings now stand at 2,346 tonnes, which remains a small share of overall reserves and suggests ongoing strategic accumulation.
Does today’s drop change silver’s structural case?
No. The fundamental imbalance between supply and demand remains intact. Silver has faced a persistent structural supply shortfall in recent years, with demand outpacing mine production for multiple consecutive years. Industrial demand is driven by expanding solar capacity and EV production—projects already under construction will still require silver regardless of a near-term Fed signal. Likewise, the monetary demand component reacts to real yields over months and years, not to a single trading day.
In practice, the same industrial tailwinds that exacerbate silver’s downside during tightening cycles also accelerate its recovery when real-yield pressure eases. Historically, silver’s rebound after a turning point in yields tends to be faster and larger than gold’s.
What should investors watch next?
Two important events are imminent and could shift the metals market.
First, the June Consumer Price Index is scheduled at 8:30 AM ET on Tuesday, July 14. Consensus calls for a modest month-on-month decline—partly due to lower gasoline prices—but core CPI, the Fed’s preferred gauge, is expected to remain near 2.9% year-on-year. A core print at or above that level would keep the market’s odds for a September rate hike elevated.
Second, Fed Chair Kevin Warsh will testify before the House Financial Services Committee at 10:00 AM ET the same day. His assessment of whether recent energy-driven price moves are transitory or more persistent could materially influence expectations for the July 29 FOMC meeting.
Investors should monitor both the gold and silver prices and the gold-silver ratio. If core CPI softens and the Fed’s tone becomes more measured, a compression of the ratio back toward its long-term average (around 65) would signal the market beginning to price a recovery in silver’s dual engines.
SOURCES
1. Silver Institute — World Silver Survey 2026 (April 15, 2026).
2. Bloomberg — reporting on China’s central-bank gold purchases (July 2026).
3. South China Morning Post — coverage of China’s gold accumulation (July 2026).
4. Federal Reserve — FOMC calendar and decisions.
5. Bureau of Labor Statistics — Consumer Price Index release schedule.
6. Reuters — reporting on Fed testimony and congressional hearings.
Disclaimer: This article is for informational purposes only and does not constitute financial or investment advice. Consult a qualified financial adviser before making investment decisions.
You may also like:
- Trump’s Hormuz Toll Is an Inflation Tax. Here’s Why Gold Fell.
- Gold Fell 1.4% on an Iran Strike. One Number Tomorrow Morning Could Change Everything.
- Trump Declared the Ceasefire Over. Gold Barely Moved.
- HSBC Cut Its Gold Forecast by $304. Then Said Gold Will Hit $4,750 by Year-End.
- The Fed Named AI Its Top Inflation Risk. Gold Noticed.
- Five Days From Now, Two Numbers Will Decide Gold’s Second Half.