Silver Is Testing Its 2026 Low Again. This Time, It’s Not Panic.
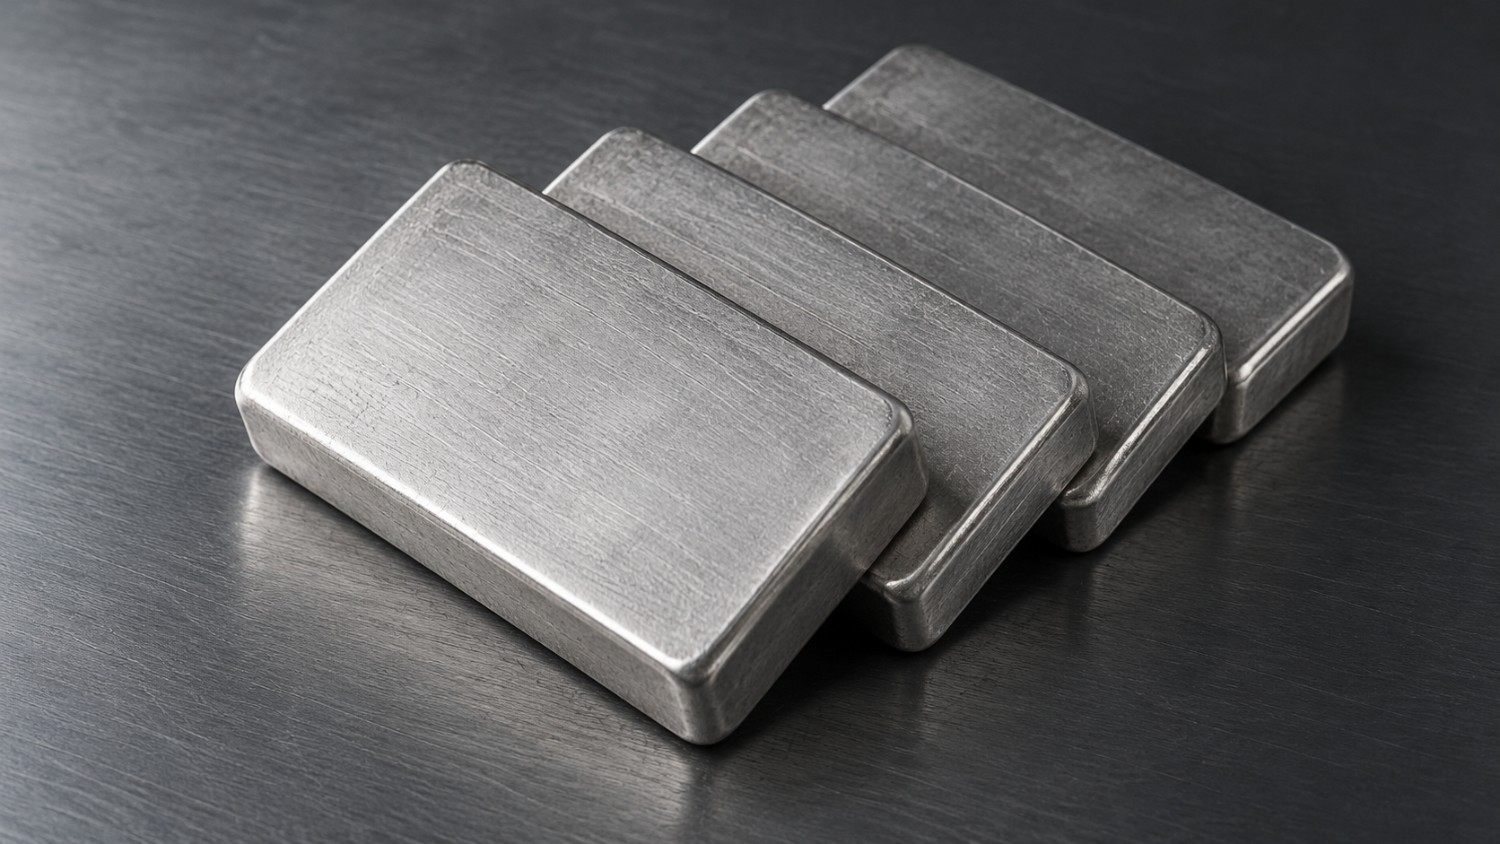
Silver is back where it was five sessions ago. On Friday, October 23, the metal broke below $54 an ounce for the first time in 2026. That drop was part of a sharp two-day slide. Gold fell under $4,000 at the same time. This morning, hours ahead of the Federal Reserve’s 2 p.m. ET decision, silver is trading in the same rough band it fell into that day, between about $53.75 and $54.50. Gold, meanwhile, sits near $4,055. The level hasn’t moved much. What has changed is the reason silver is there.
Why Is Silver Testing the Same Level Again?
The first visit was a shock. Oil spiked and inflation bets jumped. Gold and silver both sold off hard in a single session. Silver fell more than 5% that day, and gold dropped more than 2%. This retest looks nothing like that. Trading has been calm and narrow all week. Silver’s price has sat inside a tight range for five straight sessions, a pattern explored further in how to read the gold-silver ratio. This is not a single violent move. Instead, it’s a market parked in place, waiting on one event: today’s Federal Open Market Committee decision. Markets are pricing roughly a 93% chance the Fed holds its rate steady at 3.75%-4.00%. December hike odds, by contrast, sit closer to 84%.
The Edge Every Investor Needs Smarter precious metals investing starts here. The Nuggets Newsletter brings you essential market insights, Fed updates, global trends, educational videos, and much more.
What’s Actually Different From Last Time?
The gold-silver ratio is the tell. It measures how many ounces of silver it takes to buy one ounce of gold. A rising ratio means silver is losing ground to gold. A week ago, in the third week of October, that ratio sat near 71. Today it has climbed to around 75, its widest point in more than two months. That divergence first opened up three weeks ago, and it is still widening now, through a much quieter week. Silver’s dollar price looks frozen. Even so, it has kept quietly cheapening against gold through calm trading, not just during the initial panic. A level that held during a shock, and is holding again during a lull, points to something more structural than one bad day. Put simply, the market currently prices silver’s industrial-demand exposure as a bigger risk than gold’s safe-haven pull.
Gold-silver ratio, daily close, Oct 15–28, 2026. Source: internal verified price lane, cross-checked against independently reported daily closes.
Does the Industrial-Demand Story Hold Up?
Roughly half of silver demand comes from industrial uses such as solar panels and electronics. That mix makes the metal sensitive to growth worries in a way gold mostly isn’t. Traders are bracing for tighter policy to last longer. That combination of a weaker growth outlook and a higher real-rate environment hits silver on two fronts at once. Gold only has to absorb one of those forces. This split helps explain why the ratio has widened through an otherwise quiet week. It does not mean the long-term supply-deficit case for silver has gone away. Rather, it means the market is pricing a near-term growth scare more aggressively into the industrial metal than into the monetary one.
What Should Readers Take From a Level That Keeps Holding?
A price level getting retested isn’t a verdict on its own. Still, a level that holds through both a shock and a quiet week has earned more respect than one that only held once. For an owner of physical metal, the useful takeaway isn’t the exact number on the screen. Instead, it’s the pattern underneath it: short-term swings are being driven by growth and rate expectations. The case for owning gold and silver as a hedge against currency debasement runs on a much longer clock than a single Fed meeting. Today’s decision will move the price. It won’t change why most long-term holders own the metal in the first place.
Stay On Top of Gold & Silver Prices
Get important market alerts sent straight to your inbox.
SOURCES
1. CNBC — Gold Slips on Oil-Fueled Inflation Fears Ahead of Fed Meeting, Oct 28, 2026
2. GoldPrice.org — Gold Price on 23 October 2026 (Daily Close Table)
3. GoldPrice.org — Gold Price on 27 October 2026 (Daily Close Table)
4. ISA Bullion — Daily Gold and Silver Market Analysis, 21 October 2026
5. Admiral Markets — Central Banks Week: Fed Decision Today, Then ECB and BoJ, Oct 27, 2026
6. TradingKey — US Sept. PCE Preview: How Will US Stocks, the Dollar, and Gold React?, Oct 28, 2026
7. Capital Street FX — Gold Below $4,000, Silver at a 2026 Low, Oil Near $117: Commodity Report, Oct 24, 2026
8. Yahoo Finance — Silver Price Today, Wednesday, October 28, 2026
Disclaimer: This article is for informational purposes only and does not constitute investment advice. Past performance is not indicative of future results. Always consult a qualified financial advisor before making investment decisions.