

Gold trades near $4,129.62 and silver near $61.16 as of Monday, September 28, 2026. Both metals have fallen sharply this week: gold is down about 3.6% and silver roughly 4.9% from Friday’s close. Much of the coverage has focused on familiar drivers—rising U.S. real yields, a stalled U.S.-Iran diplomatic track, and repriced Fed-hike odds. That explanation is valid and has been addressed elsewhere.
But another development, occurring thousands of miles away, is unfolding at the same time and has received far less attention in relation to gold.
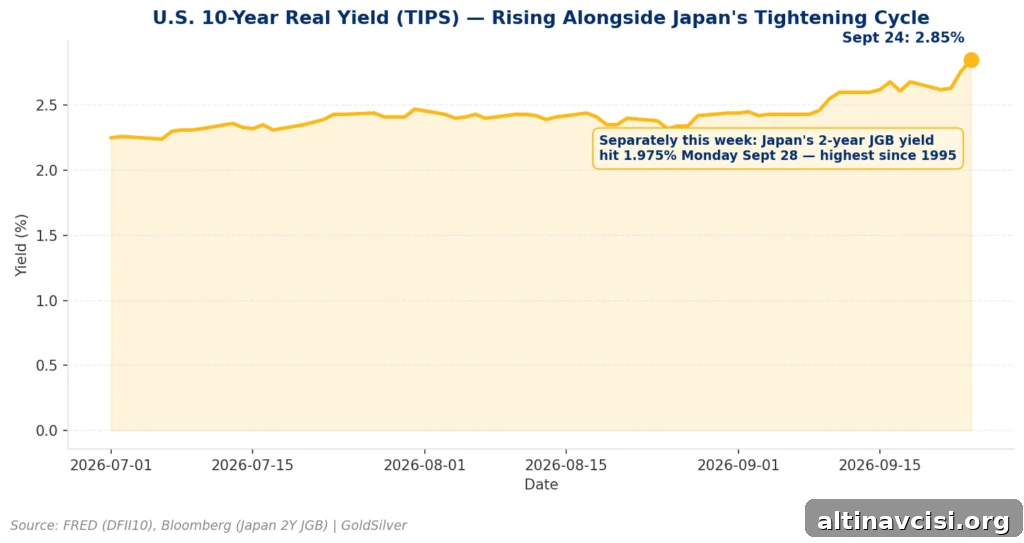
On Monday, Japan’s two-year government bond yield climbed to 1.975%, according to Bloomberg, its highest level since 1995. For decades Japan essentially offered near-zero returns on much of its sovereign debt. The market is now pricing a continuation of the Bank of Japan’s tightening cycle rather than a single rate move. That shift matters more to gold’s long-term thesis than this week’s price action alone.
Key Takeaways:
- Japan’s 2-year government bond yield reached 1.975% on Monday, September 28, 2026, its highest level since 1995, as markets price additional Bank of Japan rate hikes.
- This market move is distinct from the BOJ’s policy decision in mid-September 2026, which was a single rate increase. The market now expects more tightening beyond that one decision.
- Gold does not compete with just one bond: it competes with the global stock of “safe” sovereign debt. For the first time in this cycle, both the U.S. and Japan are repricing that safe stock higher simultaneously.
Why Is a Japanese Bond Yield a Gold Story?
Gold pays no coupon, dividend, or interest. Holding it means foregoing whatever a risk-free government bond would have paid instead. That forgone return is gold’s structural cost of ownership—its opportunity cost. Economists measure this most reliably with real, inflation-adjusted yields rather than nominal rates. When risk-free real yields rise, gold must justify its allocation against better returns in sovereign paper; when real yields fall or turn negative, gold’s relative appeal increases.
A common mistake is to equate “risk-free yields” only with the U.S. 10-year Treasury. In reality, gold competes with the entire global stock of sovereign debt that savers consider safe. For three decades Japan provided a large share of that safety at almost-zero yields. Japanese pension funds, insurers, and individual savers often accepted minimal returns for perceived safety, and some of that capital found its way into gold. That dynamic is changing now, and the two-year Japanese government bond (JGB) is the clearest indicator to watch.
The 10-year JGB reflects long-term growth and inflation expectations; the two-year is different. The two-year maturity is most sensitive to near-term central bank rate expectations. A rising two-year JGB signals that markets expect more BOJ hikes soon—and an expectation of a continued tightening cycle has implications for global opportunity-cost calculations that influence gold over multi-year horizons.
The Knowledge That Changes Everything

Two essential guides — yours free. Understand why gold matters and why fiat currencies repeatedly fail.
Is This Just a Recap of the September Hike?
No. The Bank of Japan’s policy rate was raised from 1.00% to 1.25% on Friday, September 18, 2026, and that single, anticipated move produced little immediate reaction in gold. A discrete policy decision is a data point. By contrast, a two-year JGB at a 31-year high that keeps moving higher as markets price additional tightening is a trend. Trends change multi-year opportunity-cost math, which is what drives gold’s price over extended periods. In short, the September rate decision described what the BOJ did; the current JGB move reveals what the market now expects the BOJ to do going forward.
What Does the Consensus Get Wrong About This Week’s Selloff?
Many observers treat this week’s precious-metals selloff primarily as a U.S. story: U.S. real yields rose and Fed-cut odds fell, so gold declined. That is accurate in part. The U.S. 10-year TIPS yield, a clean gauge of real returns on the safest U.S. asset, rose from 2.62% to 2.85% in three trading sessions—about a 23 basis point move. Historically, moves of that size in real yields have often pressured gold by roughly $40 to $60 per ounce.
What a U.S.-only frame misses is that this is the first time since the post-2008 bull market in gold that two of the world’s largest sovereign bond markets—the U.S. and Japan—are repricing higher together. They are moving for related but distinct reasons rather than one tightening while the other remains near zero.
Some market observers emphasize the difference in mechanics. Japan’s government debt is held predominantly by domestic investors, allowing the BOJ to manage its transition without the same pressure from foreign creditors that the U.S. might face. The U.S. relies more heavily on foreign financing for its debt, which can make similar moves there more destabilizing. Still, the common direction—less “free money” for global savers—matters for gold’s competitive position.
What Does This Actually Test for Gold?
Gold’s decade-plus bull thesis has not been fully stress-tested by this configuration: both of its two largest “safe alternative” bond markets becoming less generous at once. If a roughly 2% Japanese bond and a sub-3% U.S. real yield together still cannot out-compete gold for allocation—after thirty years where Japan alone often offered almost nothing—that would reveal something durable about how investors value certainty of purchasing power versus a modest nominal return.
There is a counterargument worth noting. A rising JGB yield typically supports a stronger yen. A stronger yen makes gold priced in yen relatively more expensive, which could reduce Japanese retail demand for gold as a currency hedge. These two forces—higher global opportunity cost for gold and potential local demand erosion in Japan—work in opposite directions. Determining which dominates requires observing the trend across quarters, not drawing a conclusion from a single week’s price moves.
Some portfolio strategists have advocated meaningful allocations to gold as a diversification tool. For example, a 60/20/20 allocation (stocks/short-term bonds/gold) was proposed to address the weakening diversification that traditional bonds have provided. That argument does not become easier to dismiss simply because safe bonds are paying more globally; it is instead reframed by the simultaneous tightening across major safe-bond markets and the uncertainty of holding any single sovereign’s paper through a tightening cycle.
What Should This Mean for Your Own Portfolio?
This is not a call to react to one week’s price move. It is a prompt to reconsider what truly competes with gold in a diversified portfolio. The competition is not a single country’s 10-year bond but the global, shifting stock of paper that claims to be risk-free. For decades Japan quietly subsidized that claim by asking its own savers to accept near-zero returns. That subsidy is ending. The central question is what replaces it, and how much of a portfolio should sit in an asset that pays no yield but answers to no central bank.
Live U.S.-dollar spot prices for both metals are tracked in real time by market price charts and are not controlled by any single country’s bond market.
Stay On Top of Gold & Silver Prices
Get important market alerts sent straight to your inbox.
People Also Asked
What is Japan’s 2-year government bond yield, and why does it matter for gold?
Japan’s 2-year government bond (JGB) yield is the return investors demand to hold Japanese government debt for two years. It is the maturity most sensitive to market expectations about where the Bank of Japan will set policy in the near term. On Monday, September 28, 2026, it reached 1.975%, a multi-decade high. It matters for gold because gold yields nothing; it competes with returns on perceived safe assets. Rising short-term safe yields shrink gold’s relative appeal.
Is a rising Japanese bond yield different from a rising U.S. Treasury yield for gold’s price?
Both raise gold’s opportunity cost. A higher safe yield anywhere makes gold relatively less attractive. The mechanisms differ: Japan’s debt is held mostly domestically, allowing the BOJ more room to manage a transition, often at the cost of currency weakness. The U.S. depends more on foreign financing, which can make similar moves more destabilizing. The important point for gold is that both major safe-bond markets are repricing higher simultaneously, which is unusual and consequential.
How is the “opportunity cost” of holding gold actually calculated?
Opportunity cost equals the return foregone by holding gold instead of a comparable safe asset, typically measured against real yields on government bonds. Historically, moves of roughly 25 basis points in real yields have correlated with $40–$60 per ounce swings in gold. This week the U.S. 10-year real yield rose about 23 basis points over three sessions, consistent with that historical relationship.
What is the risk to gold if Japan’s tightening cycle continues?
The primary risk is higher global opportunity cost: sustained increases in Japanese yields combined with elevated U.S. real yields make gold comparatively less attractive. A secondary offset is the potential strengthening of the yen, which can make gold priced in yen more expensive and reduce local retail demand. Both forces matter, and their net effect will be determined over months, not days.
Did the Bank of Japan’s rate hike in September 2026 already cause this week’s move?
No. The BOJ’s policy increase from 1.00% to 1.25% on September 18, 2026, was a single anticipated change and produced little immediate market reaction in gold. The recent move in the two-year JGB reflects market expectations for continued tightening beyond that single decision—an evolving trend rather than a one-off event.
What happens to gold if both Japan and the U.S. keep raising real yields at the same time?
There is no certainty yet. This scenario is a meaningful test of gold’s long-term bull thesis: if higher yields in both major safe-bond markets still leave gold competitive for allocation, that would be a durable signal about investor preferences for purchasing-power certainty. If not, gold could face sustained pressure. Watching how demand responds across regions and investor types will be crucial.
SOURCES
1. Bloomberg – Japan’s Two-Year Bond Yield Nears 2% as BOJ Rate Hike Bets Mount – September 28, 2026.
2. FRED (Federal Reserve Economic Data) – 10-Year Treasury Inflation-Indexed Security, Constant Maturity – observation through late September 2026.
3. GoldSilver – Coverage of the Bank of Japan rate decision and market context in September 2026.
4. Commentary and investor analysis referenced for macro context and portfolio frameworks.
Disclaimer: This article is for informational purposes only and does not constitute investment advice. Past performance is not indicative of future results. Consult a qualified financial advisor before making investment decisions.
You May Also Like:
- What Is a FOMC Meeting? What the Fed Decides and How Gold Reacts
- Gold in Your Phone: How Much Gold Is in Electronics and What It Means for Demand
- Real Yields vs. Nominal Rates: The Number That Actually Moves Gold
- How to Read a Gold Spot Price Chart: The Four Things That Actually Matter
- Central Banks Hold 80% of Reserves in Gold. Sovereign Wealth Funds Hold Under 1%.
- You Don’t Need to Take Delivery to Sell Your Gold. Here’s What Actually Happens.
- The Real Price of a 1 Gram Gold Bar Isn’t $140
- What Are Negative Real Interest Rates, and Why Does Gold Thrive in This Environment?