Today’s PMI Beat Cuts Gold Two Ways. Only One Side Has Been Priced In.
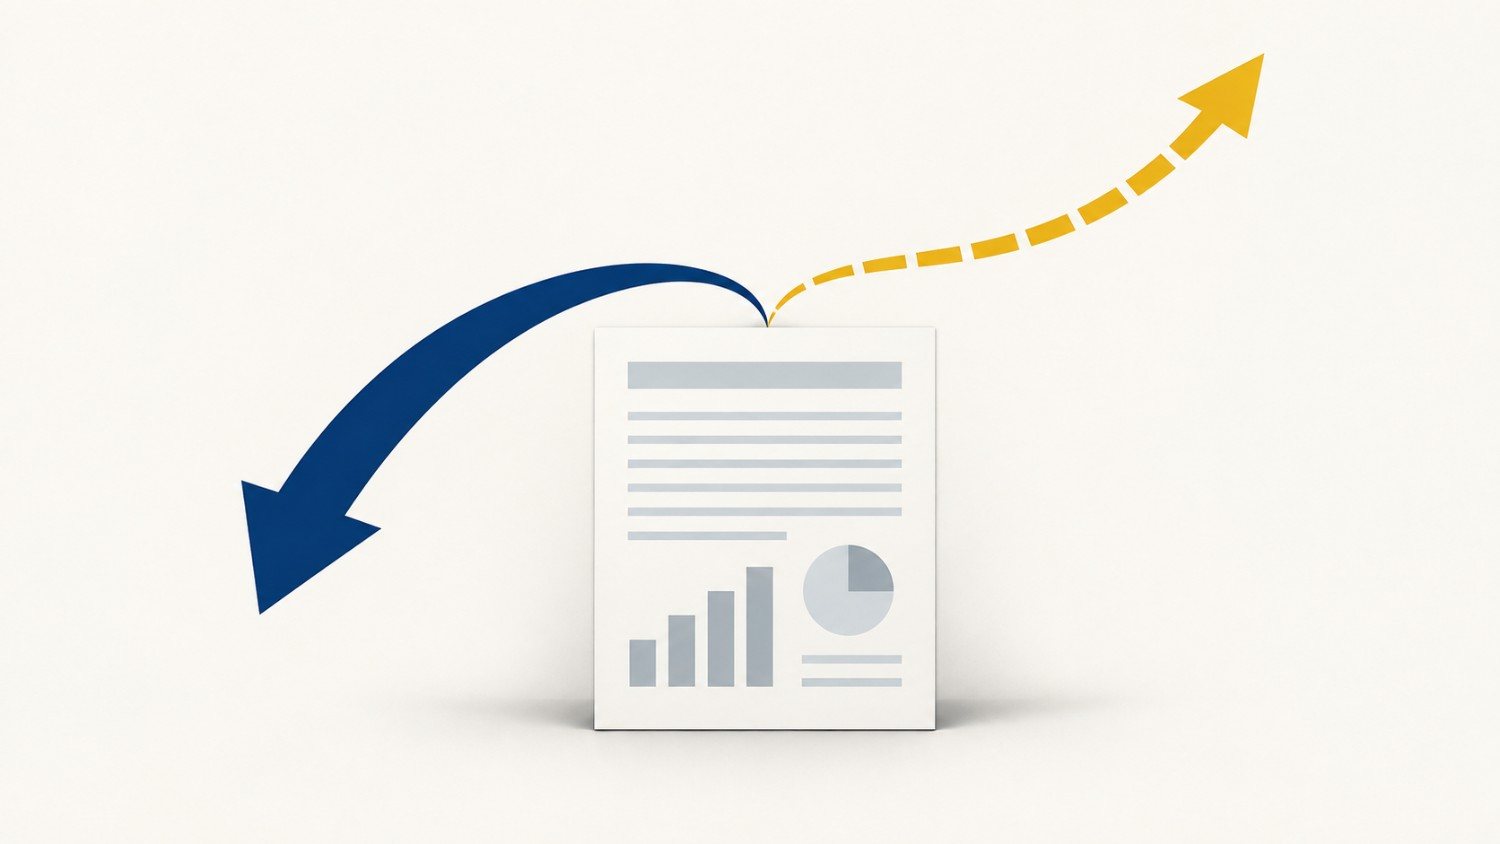
The U.S. economy just turned in its best month in more than five years. Gold fell anyway. The same report that explains why also explains why the drop might not last.
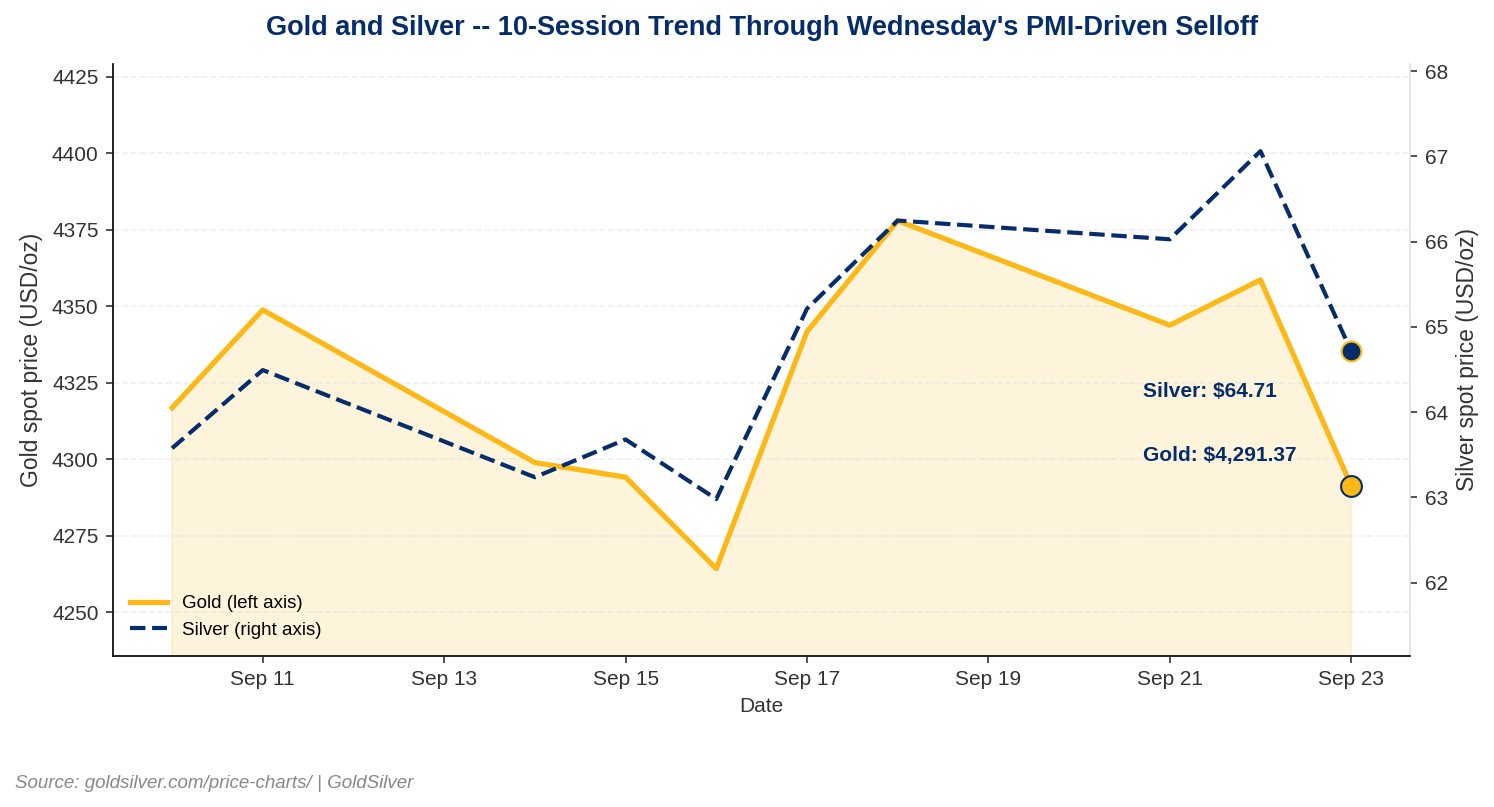
Gold is trading at $4,291.37, down 1.53% on the day. Silver is at $64.71, down 3.51%. Both figures are checked against live spot data as of 3:18 p.m. UTC Wednesday, September 23, 2026.
Key Takeaways
- Gold fell 1.53% to $4,291.37 and silver fell 3.51% to $64.71 Wednesday after S&P Global’s flash Composite PMI hit 58.4, a 62-month high that beat the 55.2 forecast.
- The same PMI report shows input costs rising at their fastest pace in four years. Order backlogs hit their most severe level in nearly two decades outside the pandemic. That’s a sign of demand-driven inflation the market has not priced into gold yet.
- Platinum (-4.37%) and palladium (-3.10%) fell alongside gold and silver. Neither metal shares silver’s industrial demand or gold’s central-bank buying. That points to a dollar-and-rates move across the whole complex, not a metal-specific story.
What Did Today’s PMI Report Actually Show?
S&P Global’s flash U.S. Composite PMI jumped to 58.4 in September. That’s up from 56.0 in August and above the 55.2 forecasters expected, per S&P Global’s September 23 release. It’s the fastest pace of U.S. business growth in 62 months, according to S&P Global’s own release. Services led the way, rising to 58.7 from 56.5. Manufacturing output jumped to 57.0 from 53.9, its strongest reading since May 2022.
Chris Williamson, S&P Global’s top economist, called it plainly: “US business continues to boom, with output growing at the fastest rate for over five years in September.”
Gold slid to session lows within minutes of the 9:45 a.m. ET release. The timing isn’t a coincidence. A beat this size firms up odds of another Fed rate hike. The CME FedWatch Tool already priced a 54.2% chance of an October hike before today’s data even landed. A stronger economy plus higher rate odds raises the cost of holding gold instead of something that pays interest, since gold pays no yield. That’s the textbook mechanism, and it’s exactly what traded today.
The Edge Every Investor Needs Smarter precious metals investing starts here. The Nuggets Newsletter brings you essential market insights, Fed updates, global trends, educational videos, and much more.
Why Might the Selloff Be Missing Half the Story?
Here’s the detail the price hasn’t caught up to yet. The same release reports input costs jumping at their steepest pace in four years. Backlogs of uncompleted work rose at the sharpest rate since May 2022. That’s the most severe supply-chain bottleneck reading in the survey’s nearly two-decade history, pandemic excluded. Williamson called the resulting power to raise prices “a worry for the inflation outlook.”
That’s a sign of demand-driven inflation sitting inside the exact report that just sold gold off. Rising real inflation pressure is normally supportive for gold. It’s the kind of currency devaluation a non-yielding, non-debasable asset is built to hedge.
So far, the tape has traded only the growth-beat half of this release. The inflation half was reported in the same document, by the same source, at the same time. It hasn’t shown up in how gold or silver are priced yet. That gap is the actual story today, not the headline number.
Does the Rest of the Complex Confirm This Is a Macro Move?
Platinum fell 4.37% today. Palladium fell 3.10%. Both moves are larger than gold’s, and platinum’s even exceeds silver’s. Neither metal shares silver’s solar, electronics, or AI-hardware demand. Neither carries gold’s central-bank buying. Their primary use is car parts called catalytic converters, a different market entirely.
Four metals with four different demand structures all fell together, by comparable or larger magnitudes. The common driver sits above any single metal’s story. That points at the dollar and rate expectations. It confirms today’s PMI print, not silver-specific industrial softness, is what moved this market.
What Does This Mean for Someone Holding Physical Gold or Silver?
This is the setup condition for financial repression, and it’s worth naming precisely. An economy hot enough to justify a rate hike is also, by this same report’s own numbers, generating rising input costs and power to raise prices.
The Fed may be hiking into a tight-supply expansion, not one where inflation is truly cooling. If so, nominal yields can rise while actual inflation keeps building underneath. That’s the scenario where holding currency, not gold, quietly loses real value.
Gold fell today because the market traded the growth half of a two-sided release. It didn’t fall because the structural case for holding it changed. If anything, today’s report added a data point supporting that case. The market just hasn’t priced it in yet.
What Should Investors Watch Next?
Watch the 10-year Treasury breakeven inflation rate, last at 2.33% as of September 22 per Federal Reserve data. A climb in the days ahead would mean the market is starting to price the inflation half of Wednesday’s release.
Thursday brings jobless claims and the Fed’s H.4.1 balance sheet release. Friday brings the University of Michigan’s final September inflation-expectations reading.
Also worth tracking: this week’s formal Trump-Xi summit talks. Wednesday’s dollar-strength read on the same selloff and how the summit and rare-earth exposure are hitting silver cover that angle separately. It’s layered on top of today’s PMI move, not its cause. See also why gold miners haven’t matched bullion’s moves this month.
Stay On Top of Gold & Silver Prices
Get important market alerts sent straight to your inbox.
SOURCES
1. S&P Global Market Intelligence — Flash US Composite PMI Press Release, September 23, 2026
2. CME Group — FedWatch Tool
3. Federal Reserve Bank of St. Louis — 10-Year Breakeven Inflation Rate (T10YIE)
Disclaimer: This article is for informational purposes only and does not constitute investment advice. Past performance is not indicative of future results. Always consult a qualified financial advisor before making investment decisions.