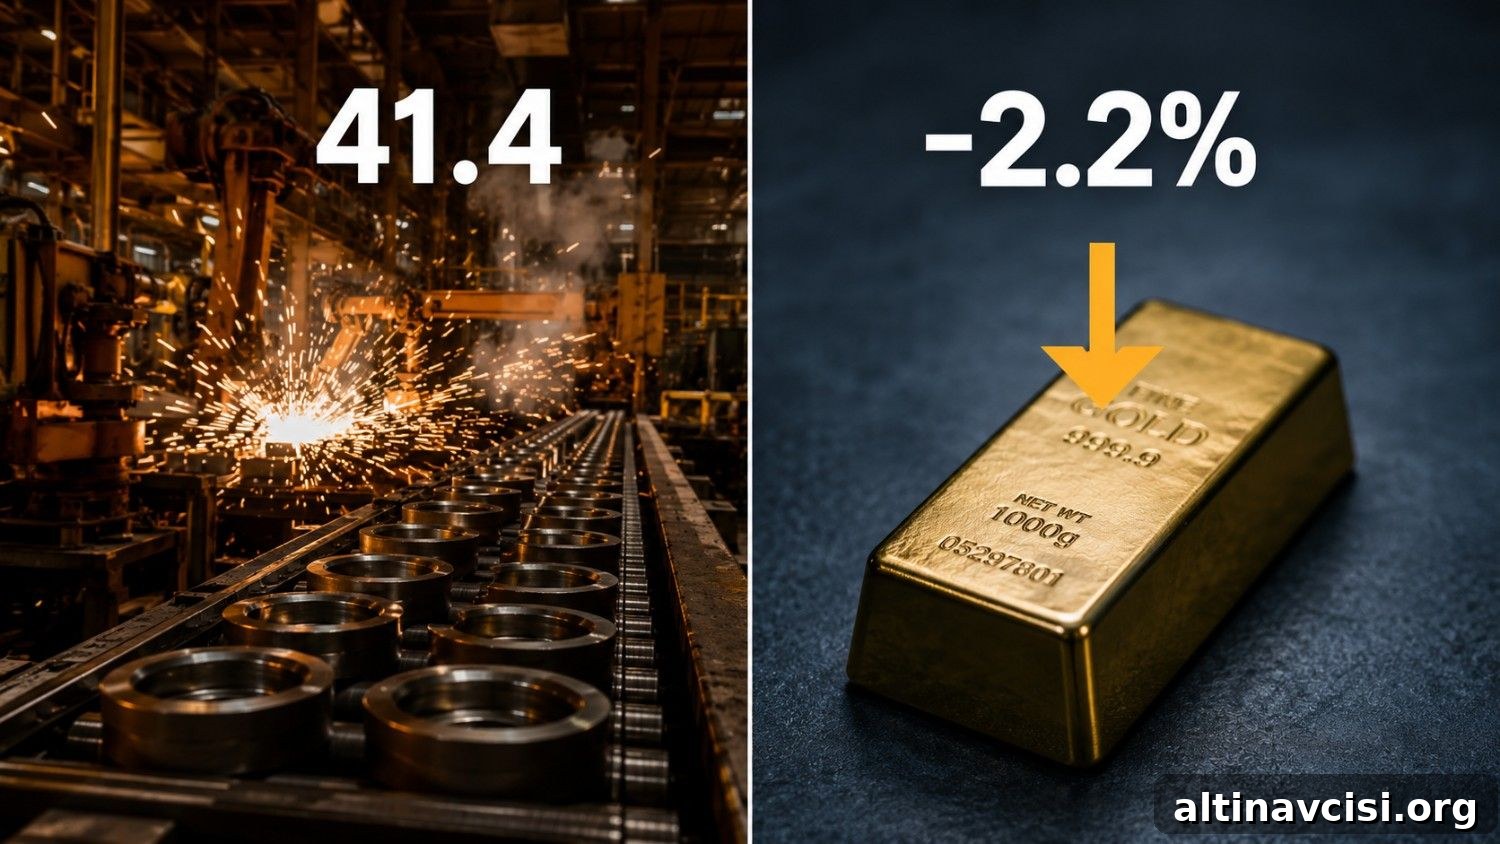
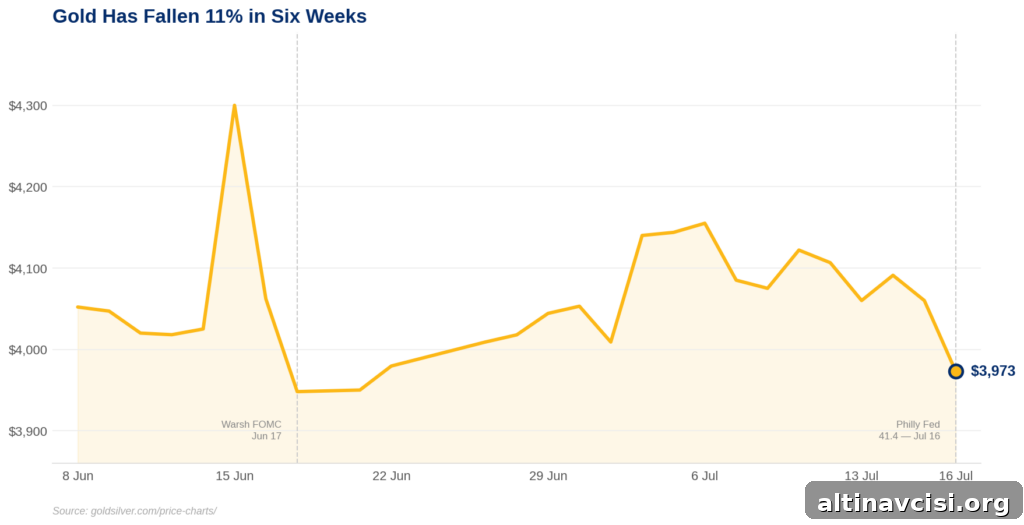
Gold fell 2.2% on Thursday, July 16, 2026, slipping to $3,973 per ounce after stronger-than-expected U.S. manufacturing data and signs of a resilient labor market. The Philadelphia Fed manufacturing index surged to 41.4 in July, far above the consensus forecast of 13. At the same time, initial jobless claims dropped to 208,000 for the week ending July 11, below the estimate of 217,000. Together these reports reinforced the view that the economy remains robust and reduced the case for near-term interest-rate cuts, putting downward pressure on gold.
This outcome is not contradictory — it reflects the mechanism through which macroeconomic strength affects interest rates, real yields, and the opportunity cost of holding non-yielding assets like gold.
Why Does Strong Manufacturing Data Push Gold Prices Lower?
Gold tends to move inversely with real yields — that is, nominal interest rates adjusted for expected inflation. When economic indicators show strength, the Federal Reserve has less reason to lower interest rates, and markets may price in the likelihood of higher or sustained rates. Higher real yields increase the opportunity cost of owning gold because gold does not pay interest or dividends. As investors seek positive returns elsewhere, demand for gold can fall and prices can decline.
On Thursday morning the transmission was clear and fast. The Philadelphia Fed index was released at 8:30 a.m. ET and by late morning gold had surrendered nearly $90 from an open near $4,060. Silver fell more sharply — roughly 4% to about $55.47 — because silver combines monetary demand with industrial demand. Strong manufacturing data can be bullish for industrial metals over time, but in the short term it can be bearish for precious metals by reinforcing a hawkish monetary outlook.
Historically, changes in real yields have had a measurable impact on the gold price. Research and market rules of thumb suggest a 25-basis-point move in real yields often corresponds to a roughly $40–$60 per ounce shift in gold, though the exact response varies with market conditions and expectations. While this week’s data did not produce an immediate rate move, it did increase the perceived probability of tighter policy. Market-implied odds for a September rate rise climbed as traders adjusted positions in response to the stronger data.
The Edge Every Investor Needs
Smarter precious metals investing begins with timely information. The Nuggets newsletter delivers market analysis, Fed updates, global trends, and educational content to help investors make informed decisions.
What Did the Philadelphia Fed Manufacturing Index Actually Show?
The Philadelphia Fed manufacturing index surveys roughly 250 manufacturers across eastern Pennsylvania, southern New Jersey, and Delaware, and serves as one of the earliest monthly snapshots of U.S. factory conditions. Readings above zero indicate expansion; at 41.4 the index signals a strong and broad-based acceleration in activity, not a marginal uptick.
In June the index was 10.3, so the July reading represents a jump of more than 31 points in a single month, far exceeding the consensus forecast of 13.0. Measures of new orders and shipments climbed, and several subindexes reached multi-year highs. Combine that surge with lower-than-expected unemployment claims and you get a picture of a manufacturing sector that is accelerating while the labor market remains tight — a combination that makes it harder for the Fed to justify easing policy in the near term.
What Should Gold Investors Watch Next?
Key data ahead include the University of Michigan’s preliminary consumer sentiment and inflation expectations reading for July, due Friday, July 17. Longer-term inflation expectations have stayed elevated since geopolitical tensions began earlier in the year. If those expectations rise further, it could strengthen the Fed’s case for higher or sustained interest rates, adding pressure on gold.
The Federal Open Market Committee meets on July 28–29. While a rate hold is the current consensus, recent data — including retail sales for June, the unexpectedly strong Philly Fed survey, and tight jobless claims — have reduced the chance that the Fed will signal easing soon. Gold is trading near levels not seen since November 2025 and stands roughly 29% below its January 28, 2026 peak of $5,589 per ounce.
Still, one strong data release does not rewrite the long-term factors that influence demand for money-like assets. The U.S. fiscal picture and the trajectory of public debt remain important structural drivers. For example, the government ran a substantial deficit in fiscal 2025 and interest costs on that debt are large and rising. Over time, a persistent need to finance deficits can increase the money supply and influence confidence in fiat currency, considerations that feed into a long-term allocation to physical gold for some investors. Those structural dynamics did not change because of a single manufacturing survey.
In short: today’s drop in gold reflects a short-term reaction to a resilient economy that reduces the likelihood of immediate rate cuts. Over the longer horizon, fiscal pressures and broader monetary conditions continue to shape the strategic case for gold as a store of value.
Stay On Top of Gold & Silver Prices
Get important market alerts sent straight to your inbox.
SOURCES
1. Federal Reserve Bank of Philadelphia — Manufacturing Business Outlook Survey, July 2026
2. Bureau of Labor Statistics — Unemployment Insurance Weekly Claims, week ending July 11, 2026
3. CME Group — FedWatch Tool, September 2026 FOMC Meeting Probabilities
4. GoldSilver.com — Live Gold and Silver Spot Prices, July 16, 2026
5. World Gold Council — Gold and Real Yields: The Historical Relationship
6. Congressional Budget Office — Monthly Budget Review: Summary for Fiscal Year 2025
Disclaimer: This article is for informational purposes only and does not constitute financial or investment advice. Consult a qualified financial adviser before making investment decisions.
You May Also Like:
- Warsh Told Wall Street to Stop Watching the Fed. Gold Already Knew.
- Gold Falls as Retail Sales Confirm the Fed Has No Reason to Cut
- Silver Dropped 1.4% Today. Gold Didn’t. The Ratio Just Hit 70:1.
- Gold Holds as CPI and PPI Both Miss. Here’s Why.
- Gold Is Flat. Oil Is Up 9%. Here’s Why.
- Gold and Fed Policy: When the System Picks Winners