Key Takeaways
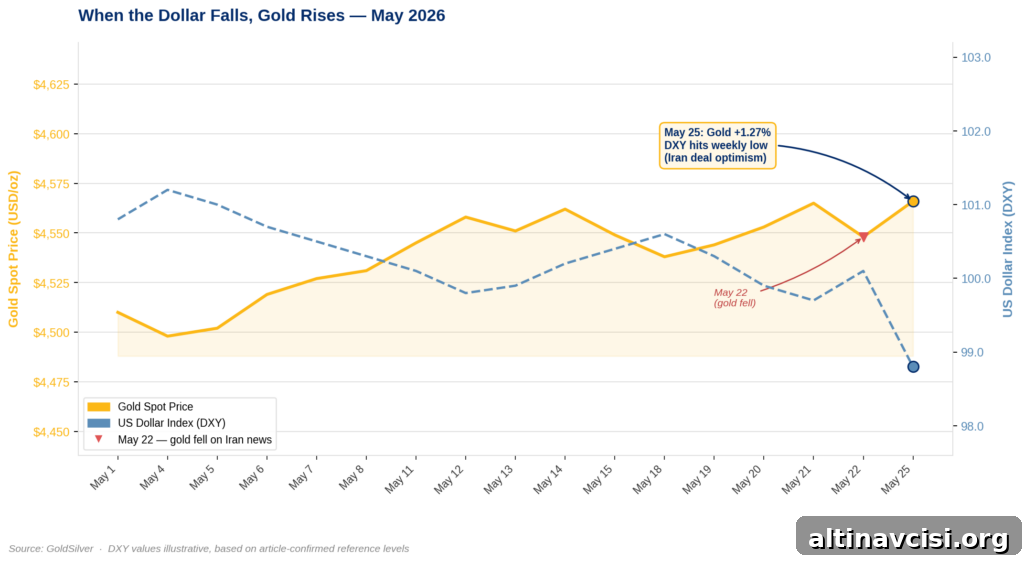
- Gold rose $57 (+1.27%) to $4,565.99 on May 25 as the dollar weakened amid optimism around a US‑Iran framework to reopen the Strait of Hormuz, making gold cheaper for buyers who transact in non‑USD currencies.
- The Hormuz agreement is not finalized: leaders have said talks remain incomplete, Iran has not committed on nuclear issues, and US officials warned alternative steps remain possible if diplomacy stalls.
- The long‑term case for precious metals remains intact: US federal debt, ongoing monetary pressures, and resurgent central bank gold buying are structural factors that don’t reverse because of a single headline.
The Iran peace narrative pushed gold down on May 22, yet the same theme drove it up more than 1% on May 25. That apparent contradiction is not a confusion; it illustrates how different market variables move gold in different directions.
On Memorial Day, when US markets were closed and London set the price, gold climbed $57 to $4,565.99 after weekend reports indicated the US and Iran had “largely negotiated” a framework to reopen the Strait of Hormuz.
Three days earlier, the identical headlines had pushed gold lower. Understanding why the outcome flipped is more useful than reacting to headline noise.
Why Did Gold Fall on Iran News Three Days Ago?
The May 22 decline was driven by inflation expectations. Peace progress lowered oil prices, easing inflation pressure and slightly increasing the Fed’s latitude to keep rates higher. Markets interpreted that as one less reason to own gold as an inflation hedge, producing a modest pullback.
That move did not signal a loss of faith in gold. It reflected a single variable — the short‑term inflation outlook — shifting down a bit while the structural supports for gold remained in place.
The Edge Every Investor Needs
Smarter precious metals investing starts here. The Nuggets Newsletter brings you essential market insights, Fed updates, global trends, educational videos, and much more.
Why Is the Same Story Pushing Gold Higher Today?
On May 25 the decisive factor was the dollar, not inflation. Optimism about Hormuz eased oil further, but the larger market impact was a weaker US dollar index, which fell to its lowest level in a week. A softer dollar makes gold less expensive for buyers using other currencies, increasing demand and lifting the price.
Think of buyers in Japan, Germany, or India: they convert local currency into dollars before purchasing bullion. When the dollar weakens they can acquire more gold with the same local funds, which boosts demand and pushes prices higher.
Gold’s long‑standing inverse relationship with the dollar explained the May 25 rally: a weaker dollar, higher gold. That same Iran headline affected inflation views earlier in the week, producing the opposite short‑term reaction.
What Is the Gold-Silver Ratio Signalling?
Silver outpaced gold on May 25, rising 3.1% to $77.87 versus gold’s 1.27% gain, tightening the gold‑silver ratio from about 60 to 58.6. When silver significantly outperforms gold it often signals rising risk appetite or strengthening industrial demand.
Lower oil cuts manufacturing costs, a weaker dollar makes silver more affordable for Asian buyers, and easing Strait of Hormuz tensions would relieve supply pressures that have strained industry. A move from a 60 ratio toward 50 historically precedes strong silver rallies; today’s gain looks like the market beginning to price renewed economic activity rather than a single‑day spike.
Is the Hormuz Deal Actually Going to Happen?
Markets have started to price in a deal, but the facts remain unsettled. US leaders have acknowledged talks are not complete. Key unresolved points include the timing of sanctions relief, Iran’s nuclear commitments, and terms for control of the waterway after any ceasefire. Iranian officials say no nuclear commitments have been made. That gap between “largely negotiated” and “signed” is where agreements frequently unravel.
There is a clear risk to the current rally: if a deal is finalized and oil collapses sharply, the dollar could strengthen again and the inflation‑hedge case for gold would weaken simultaneously. Positions held solely on the hope of Hormuz optimism would be vulnerable.
An additional angle many observers miss is the European Central Bank. ECB officials have warned they will act if the Iran conflict threatens price stability. The EU’s spring forecast raised its 2026 inflation projection, and markets now expect ECB rate hikes. If oil remains high and the ECB tightens more, the euro could strengthen, the dollar could weaken further, and that dynamic would reinforce the price drivers that lifted gold on May 25. The ECB’s path is a second lever on precious metals that deserves attention.
Watch next week’s Personal Consumption Expenditures (PCE) index — the Fed’s preferred inflation measure — as a near‑term signal. Any further statements by US officials before that release could also move markets.
What Does Today’s Move Mean for the Long-Term Case?
Daily catalysts matter, but they operate against a persistent backdrop. The larger environment includes nearly $39 trillion in US federal debt, a central bank policy mix caught between inflation and slower growth, the long‑term erosion of the dollar’s purchasing power, and several years of central‑bank gold accumulation. Those structural forces do not flip with a single headline.
May 25’s rally was primarily a currency story. Tomorrow’s driver will likely be different. What remains constant is the underlying pressure supporting precious metals.
Gold as of 12:48 UTC, May 25, 2026: $4,565.99 (+1.27%). Silver: $77.87 (+3.11%).
Stay On Top of Gold & Silver Prices
Get important market alerts sent straight to your inbox.
SOURCES
1. nFusion Solutions — Live Spot Price Feed
2. CNBC — Coverage of US-Iran negotiations
3. Reuters via Al-Monitor — Reporting on US comments about Iran
4. NPR — US‑Iran negotiations update
5. Bloomberg — ECB comments on price stability risks
6. European Commission — Spring 2026 Economic Forecast
7. Reuters via Investing.com — ECB and Iran war impact coverage
8. US Congress Joint Economic Committee — Monthly Debt Update, May 2026
9. Federal Reserve Bank of Minneapolis — Historical CPI data
10. World Gold Council — Central bank gold demand trends
11. World Gold Council — Historical gold and silver price data
Disclaimer: This article is for informational purposes only and does not constitute financial or investment advice. Consult a qualified financial adviser before making investment decisions.
You May Also Like:
- Gold Falls 0.5% on Iran Deal: The Floor Holds
- Is Gold Being Repriced? 5 Major Institutions Say Yes.
- Silver Dropped 12%. Gold Dropped 3%. That Gap Is the Story.
- Gold Price Holds Firm After Hawkish Fed Minutes — Here’s Why
- Why London Still Sets the Gold Price — and Asia Doesn’t
- Gold Price at ~$4,502: Is the Dip a Buy? BofA Says $6,000
- Gold Didn’t Fall on Iran Peace News. That’s the Point.
- Trump Called Off the Strike. Gold’s Real Risk Is Still $39 Trillion.