
The chair of the Federal Reserve testified to Congress today and delivered a message that every saver should hear. Fed rate policy — the principal tool meant to manage the economy — has effectively created a generation of homeowners and, in turn, a generation left behind. Chairman Kevin Warsh told the House Financial Services Committee plainly that he wants monetary policy that avoids “boom-and-bust” dynamics and does not make one generation significantly better positioned to buy its first home than the next.
This is not an abstract critique. It is an acknowledgment from the agency that sets the price of money that the system it oversees can reward or punish individuals based largely on timing rather than prudence or effort.
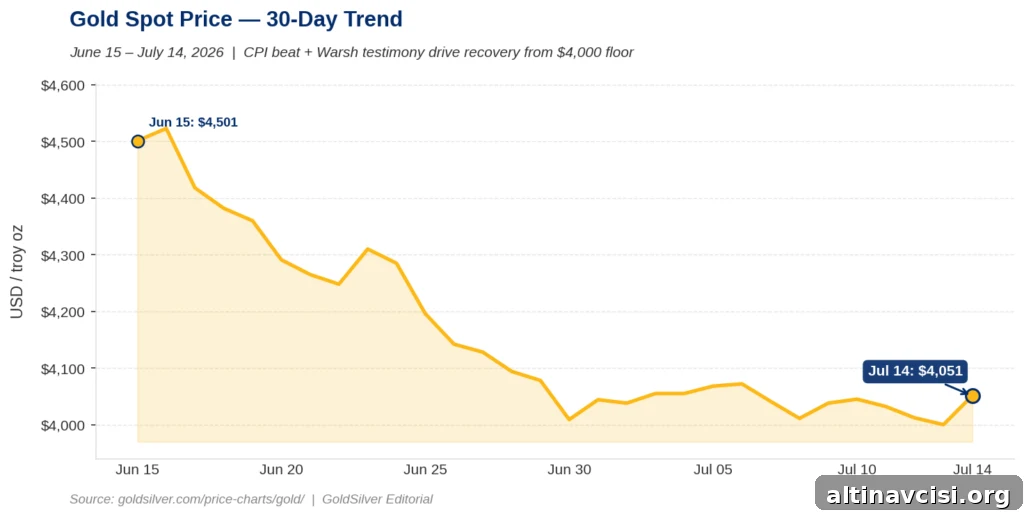
Gold rose to $4,054.67 on Tuesday — up $53.76, or 1.32% on the session — after June consumer-price data showed a larger-than-expected decline. Silver climbed to $58.77, a 1.96% gain. Both metals recovered sharply from two-week lows recorded on Monday.
Why Did the Fed Chair Raise Housing Policy in a Monetary Testimony?
Warsh’s comments on housing were not a rehearsed talking point; they were answers to direct questions about the unintended consequences of the Fed’s post-pandemic rate cycle. He described the mechanism candidly: when the Fed cut interest rates to near zero in 2020 and 2021, millions of buyers secured 30-year mortgages in the roughly 2.65%–3.5% range. That window, which included record lows in early 2021, represented what Warsh described as “a once-in-a-lifetime opportunity to get the first house.”
Those fortunate borrowers built equity as home prices rose. Today’s first-time buyers, by contrast, face a 30-year fixed mortgage averaging about 6.49% and must contend with homes that cost substantially more than they did four years ago. The monthly payment on a median-priced home now consumes roughly 32% of median household income, above common lender thresholds for sustainable housing costs. The consequence: the market is divided not primarily by income or discipline, but by the year in which people took out mortgages.
Approximately 80% of outstanding U.S. mortgages currently carry rates at or below 6%, making many current owners reluctant to sell. At the same time, surveys show a growing share of Americans view homeownership as unrealistic in 2026. Two people with similar saving habits can therefore face very different financial outcomes simply because of the calendar year when they applied for a mortgage.
Why Does Fed Monetary Policy Create Winners and Losers?
This outcome stems from a structural feature of fiat currency systems: one central authority—the Federal Reserve—has the power to set the economy-wide price of money. When that price is set too low for an extended period, asset prices inflate. From 2020 into 2022, lower rates inflated housing values and pushed stock indices higher. Those who already owned assets saw their net worth grow; savers who held cash saw purchasing power decline. When the Fed raised rates to rein in inflation, it effectively froze the elevated asset market. The result is first-time buyers facing both higher prices and higher borrowing costs — an outcome produced by policy, not individual choices.
Warsh labeled parts of that strategy a mistake, criticizing the Fed’s flexible average inflation targeting framework for tolerating “a little more inflation” that ultimately became “a lot more.” He called for a “regime change” in how the Fed approaches its mandate. Even if policy philosophy shifts, however, it cannot erase the cumulative distortions already built into prices and purchasing power over the past five years. The unequal impact across cohorts is now embedded in the housing market.
What Does This Mean for Gold Holders?
Gold behaves differently from financial assets that are affected directly by interest rates and Fed policy. It carries no mortgage rate, is not subject to refinancing dynamics, and cannot be diluted by the monetary actions Warsh described. An ounce of gold held in 2020 is the same physical ounce today, and historically its purchasing power has moved opposite to the dollar that prices it. That separation from the banking and credit system makes gold a form of value that cannot be manipulated by the timing of rate cycles or by refinancing incentives.
Large institutions publish varying targets for gold’s path; these forecasts rest on a common structural premise: the Fed navigating between persistent inflation and the economic costs of tightening, with the dollar bearing significant adjustment risks. Warsh’s testimony does not immediately alter short-term price action, but it reinforces a broader structural case for holding sound money outside the credit system.
What Should Investors Watch Next?
Warsh will testify before the Senate Banking Committee on Wednesday, July 15. Markets will scrutinize his language for clues about the Fed’s reaction to cooler June inflation data. The next decisive policy moment is the Federal Open Market Committee meeting on July 28–29. If markets continue to pare back the odds of a September rate hike, gold could move toward higher levels; if tightening odds remain elevated, the $4,000 area may act as a structural support. Either way, Warsh’s admission is now on record: the institution that manages the dollar acknowledged under oath that its tools can create unequal outcomes for individual savers.

The Edge Every Investor NeedsSmarter precious metals investing starts here. The Nuggets Newsletter delivers market insights, Fed updates, global trends, and educational content.
SOURCES
1. Federal Reserve — Testimony of Chairman Kevin Warsh, Semiannual Monetary Policy Report to Congress, July 14, 2026
2. Bureau of Labor Statistics — Consumer Price Index Summary, June 2026 (July 14, 2026)
3. National Association of Home Builders — NAHB/Wells Fargo Housing Opportunity Index, Q1 2026 (May 21, 2026)
4. Freddie Mac — Primary Mortgage Market Survey, Week of July 9, 2026
5. Live Gold Spot Price, July 14, 2026
Disclaimer: This article is for informational purposes only and does not constitute financial or investment advice. Always consult a qualified financial adviser before making investment decisions.
You May Also Like:
- Warsh Testified. Gold Jumped $90. The Signal Everybody Missed Was in His Report.
- Gold Jumped $90 This Morning. June CPI Just Explained Why.
- Silver Fell 3.8% Today. Gold Fell 2.9%. The Gap Has a Name.
- Trump’s Hormuz Toll Is an Inflation Tax. Here’s Why Gold Fell.
- Gold Fell 1.4% on an Iran Strike. One Number Tomorrow Morning Could Change Everything.
- Trump Declared the Ceasefire Over. Gold Barely Moved.