
Gold has risen about 6% this week, closing Wednesday at $4,247 and briefly reaching $4,300 for the first time in seven weeks. That sharp move was driven by a single surprising jobs number released Wednesday morning, growing optimism that oil shipments through the Strait of Hormuz may normalize, and a Federal Reserve facing a genuine policy dilemma. To understand how tomorrow’s U.S. jobs report could move gold and silver, it helps to follow the chain of cause and effect that produced this rally.
What Broke the Market Open This Week?
On Wednesday morning payroll firm ADP reported that private employers added just 44,000 jobs in July—well below consensus expectations near 70,000 and far lower than June’s revised 95,000. That one data point significantly altered the market’s odds for a September Federal Reserve rate increase.
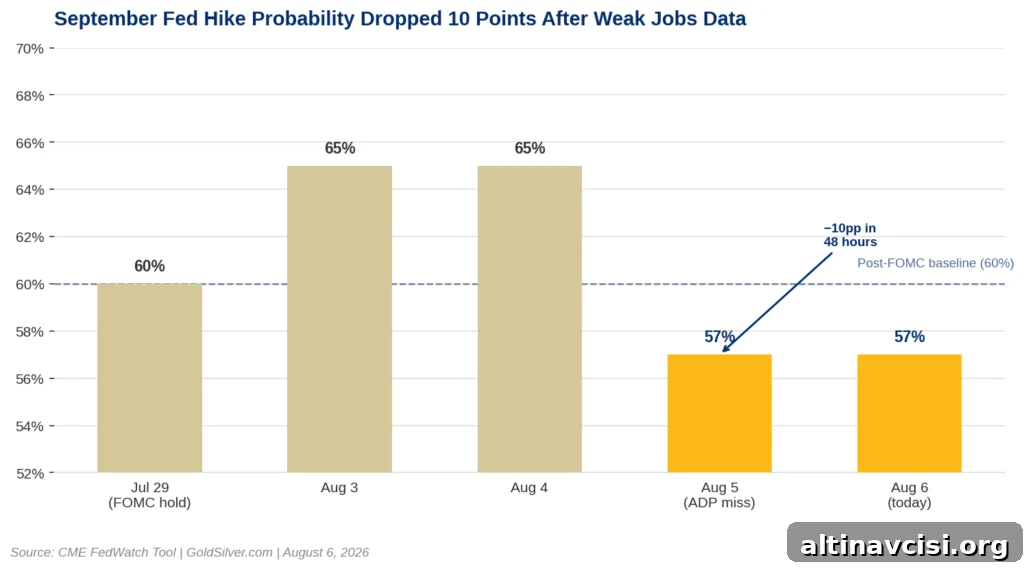
Before the ADP release, markets priced roughly a 67% chance of a September rate hike. By Thursday morning that probability had moved down to about 57%—a roughly 10 percentage-point swing in under 48 hours, according to market-implied data. That rapid repricing feeds directly into precious metals through Treasury yields and the dollar.
When expectations for rate increases fall, Treasury yields typically decline. Lower yields reduce the opportunity cost of holding non-yielding assets like gold. If the U.S. dollar weakens at the same time, gold’s gains are amplified. The U.S. Dollar Index slipped to about 99.65 this week, a six-week low, and yields fell enough to help push gold up around 6% across four sessions.
Does a Weak ADP Print Guarantee a Weak NFP?
No. ADP and the Bureau of Labor Statistics use different methodologies and sample different employer populations, so their numbers often diverge. In June 2026, for example, ADP’s revised private payrolls were +95,000 while the official BLS nonfarm payrolls (NFP) showed +57,000—a gap of 38,000 jobs for the same month. ADP’s result signals direction but is not a reliable precise forecast for the official NFP.
Current consensus for July’s NFP sits near 80,000, up from June’s +57,000. Major bank forecasts range widely—from roughly 20,000 to 120,000—so the actual print could push markets in very different directions depending on where it lands.
ADP also reported a divergence in wage dynamics: workers who changed jobs saw year-over-year pay growth of 7.0%, the fastest since August 2025, while job-stayer wage growth held near 4.4%. That split matters because the Federal Reserve watches both hiring and wage momentum. A headline slowdown in hiring combined with faster wage growth for job-changers sends a mixed signal about inflation pressures.
How Will Tomorrow’s NFP Move Gold and Silver?
The reaction typically follows three steps. First, the NFP print reshapes expectations for a September Fed hike. A soft print near or below 80,000 would likely push hike probability lower and support gold. A strong print above 120,000 would reverse much of this week’s repricing and likely pressure gold lower.
Second, Treasury yields usually adjust within minutes of the 8:30 a.m. ET release. Gold often tracks yields in real time during these high-impact data sessions because yields directly influence the opportunity cost of holding bullion.
Third, silver typically magnifies gold’s directional move. This week silver rose about 6.7% versus gold’s 6.0%, reflecting both the same monetary dynamics and an additional industrial demand narrative. If the NFP is soft, silver could again outperform gold due to the combined monetary and industrial bids.
What Is the Second Force Driving This Week’s Move?
A second important factor is progress on a proposed shipping corridor through the Strait of Hormuz. Iran and Oman have agreed on coordinates for a corridor framework, and oil prices fell to about $74 per barrel, a three-week low. Lower oil reduces the energy-driven component of inflation and weakens the case for further Fed tightening.
That said, the Hormuz arrangement remains a framework rather than a finalized, verified agreement. Key details—scope, inspection procedures, and the U.S. naval role—are unresolved. Previous signals about Hormuz have shifted multiple times this year. Market positioning suggests traders are pricing in partial progress, not a fully confirmed resolution.
What Does This Mean for Gold and Silver Holders?
The structural drivers for gold remain intact. Central banks continued heavy purchases in Q2 2026, acquiring a record quarterly amount. Sovereign demand has persisted even while gold traded near $4,000—well below the January all-time high. Long-term accumulation by official buyers reflects diversification motives and structural balance-sheet choices that do not flip on a single data release.
Tomorrow’s NFP is an important tactical event and will certainly move prices in the short term. But whether the print is soft or strong, it cannot change the broader fiscal trajectory, long-running dollar pressures, or the strategic logic that underlies central bank buying. Those forces evolve over months and years, not minutes at 8:30 a.m. ET on a Friday.
This week’s roughly 6% gain in gold mainly reflects the market repricing one variable: the odds of a September rate hike. The NFP release will determine whether that repricing holds or partially reverses.
SOURCES
ADP Research: ADP National Employment Report (August 5, 2026). CME Group: FedWatch Tool (accessed August 6, 2026). Bureau of Labor Statistics: The Employment Situation — June 2026. World Gold Council: Gold Demand Trends Q2 2026 (July 30, 2026). Reuters and other reporting on Hormuz developments (August 5–6, 2026). Commodity price reporting services for live gold and silver spot prices (August 6, 2026).
Disclaimer: This article is for informational purposes only and does not constitute investment advice. Past performance is not indicative of future results. Always consult a qualified financial advisor before making investment decisions.
You May Also Like:
- Why Is Silver Outperforming Gold? A Multi-Year Deficit Explored
- Five Market Movers Today: Hormuz, ISM, Hecla, Barrick and Fed Signals
- Jobs Missed; Gold and Silver React—A Snapshot of Market Dynamics
- South Korea’s Central Bank Resumes Gold Purchases After 13 Years
- How Energy, Geopolitics and Labor Data Are Shaping Metal Prices