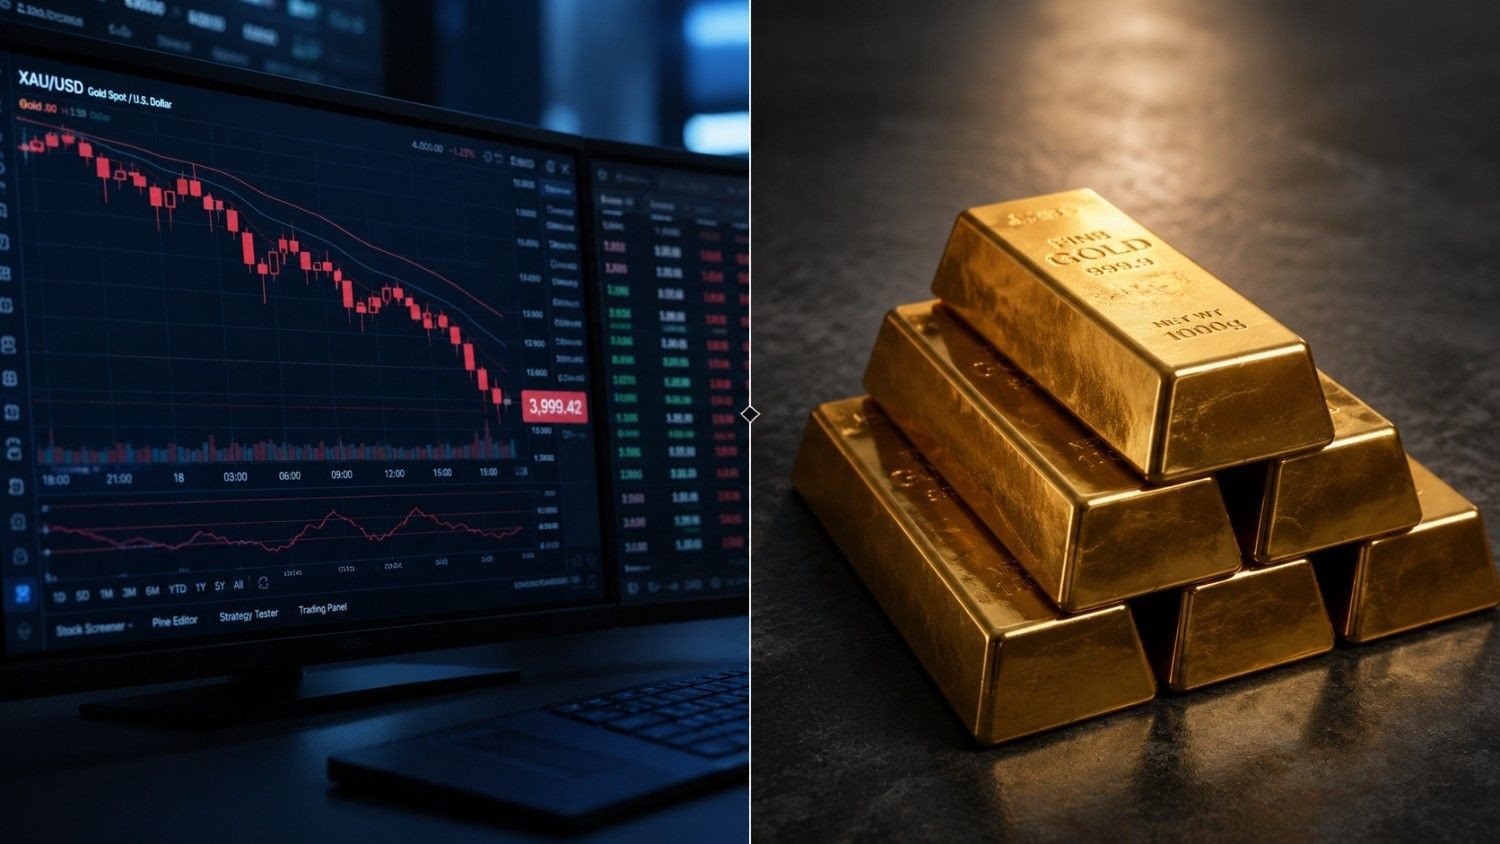
Gold Rebounds to $4,392 as Sentiment Crashes to 51 and Inflation Expectations Rise

The University of Michigan released its preliminary Consumer Sentiment Index for August at 10am ET on Friday, and the number landed well below expectations. The reading came in at 51 — against a consensus forecast of 54.5 and a July final of 55.2. That is a decline of roughly 8% in a single month, reversing two consecutive months of improvement.
At the same time, one-year inflation expectations moved higher in the survey, rising to 4.3% from 4.2% in July. That combination — growth confidence falling while price expectations rise — is precisely the stagflation fingerprint that precious metals investors have been watching for.
Then came the 10am ET release. The UMich miss reversed gold’s Friday trajectory. Spot gold had fallen to a session low of $4,311 earlier in the morning; following the data, it rebounded sharply and is trading near $4,392 as of this writing, per Altinavcisi/price-charts/. Silver moved in the same direction, trading near $65.29.
What Does the University of Michigan Consumer Sentiment Index Actually Measure?
The University of Michigan Surveys of Consumers measures two things simultaneously: how people feel about their current financial situation, and what they expect from the economy over the next six to twelve months. It also captures their inflation expectations directly — what consumers believe prices will do over the coming year.
When sentiment falls and inflation expectations rise at the same time, the survey is describing a specific economic condition. Consumers feel worse about their economic future while also expecting to pay more for the things they need. That is not a recession signal in isolation. It is a stagflation signal — the scenario where growth slows or stagnates while inflation remains elevated.
“Consumer sentiment fell about 8% this August, ending two consecutive months of improvement,” said Joanne Hsu, Director of Surveys of Consumers at the University of Michigan. “While views of personal finances saw only minor declines, expected business conditions sank 11% for the short run and 17% for the long run.”
The magnitude of the business conditions decline — particularly the 17% drop in long-run expectations — is the detail that matters. Consumers are not just feeling cautious about the next few months. They are reassessing the next several years.
The Edge Every Investor Needs Smarter precious metals investing starts here. The Nuggets Newsletter brings you essential market insights, Fed updates, global trends, educational videos, and much more.
Why Does This Combination Matter for Gold?
Gold performs differently depending on which part of the economic cycle is driving events. In a standard recession, growth fears dominate and real yields fall — gold typically rallies. In a standard inflationary environment, the Fed tightens, real yields rise, and gold faces headwinds. The stagflation scenario sits differently because it puts the Fed in an impossible position: tightening policy to fight inflation risks accelerating the economic slowdown that consumers are already anticipating.
That policy bind is what gold prices as a sustained tailwind. When the Fed cannot tighten aggressively because growth is fragile, real yields stay compressed. Non-yielding assets like physical gold become relatively more attractive. At the same time, rising inflation expectations provide the structural case for holding an asset that preserves purchasing power outside the financial system.
This morning’s data makes that bind more explicit. The August preliminary came just hours after July retail sales fell 0.6% — the largest monthly decline in more than a year. Combined with Wednesday’s subdued CPI print and Thursday’s flat PPI headline, the data this week delivered three consecutive signals pointing in the same direction: the economy is softening faster than the consensus expected.
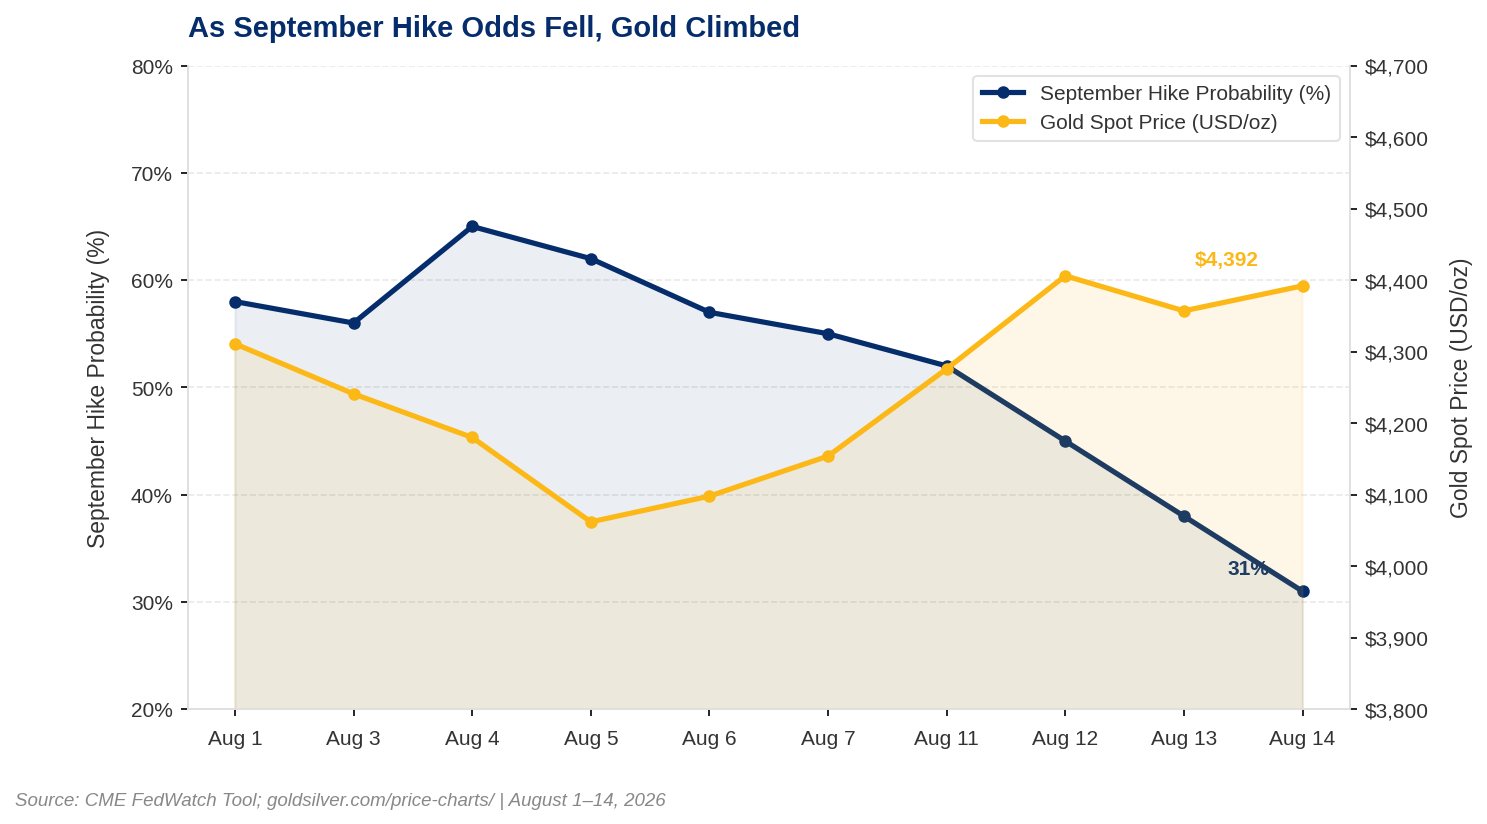
Consequently, the market-implied probability of a September Federal Reserve rate hike has fallen sharply. One week ago, roughly 50% of market participants expected a 25-basis-point increase at the September 15–16 meeting. As of Friday morning, that figure sits at approximately 31%, per CME FedWatch. The remaining 69% now expect the Fed to hold.
What Are Sound Money Investors Watching Right Now?
Furthermore, for investors holding physical gold and silver over a multi-year horizon, the weekly price move is context — not thesis. Understanding the mechanism behind today’s move matters, however, because it clarifies which part of the structural case is activating right now.
The purchasing power case for gold does not require an economic collapse. It requires only that consumers consistently experience price increases that outpace their income growth — precisely the condition the UMich survey has been describing for the better part of two years. When official data confirms what households already feel, it closes the gap between the academic argument for sound money and the lived experience of owning it.
Meanwhile, silver carries the same structural support, with an additional layer of industrial demand that tends to recover when the economic picture stabilizes. The current gold-silver ratio of approximately 67:1 remains historically elevated relative to the 50-year average of around 60:1, which historically has resolved toward silver outperformance.
As a result, the week ahead brings the FOMC minutes from the July 28–29 meeting on Wednesday, August 19 — the session that produced a 9-3 hold vote with three hawkish dissenters (Hammack, Kashkari, and Logan). Those minutes will clarify how much appetite for a September hike actually exists inside the committee, regardless of what the market is currently pricing.
For now, the data is speaking. Two months of improving consumer sentiment ended this morning, and the reversal arrived packaged with a signal the Fed cannot easily ignore.
Stay On Top of Gold & Silver Prices
Get important market alerts sent straight to your inbox.
SOURCES
1. University of Michigan, Surveys of Consumers — Preliminary August 2026 Consumer Sentiment Release. sca.isr.umich.edu
2. US Census Bureau — Advance Monthly Retail and Food Services Sales, July 2026, released August 14, 2026. census.gov/retail
3. CME Group — FedWatch Tool, September 2026 rate probabilities, August 14, 2026. cmegroup.com
4. Bureau of Labor Statistics — Consumer Price Index Summary, July 2026, released August 12, 2026. bls.gov/cpi
5. Bureau of Labor Statistics — Producer Price Index Summary, July 2026, released August 13, 2026. bls.gov/ppi
6. Federal Reserve — FOMC Statement, July 29, 2026. federalreserve.gov
7. Altinavcisi — Live Gold and Silver Spot Prices, August 14, 2026. Altinavcisi/price-charts/
Disclaimer: This article is for informational purposes only and does not constitute investment advice. Past performance is not indicative of future results. Always consult a qualified financial advisor before making investment decisions.