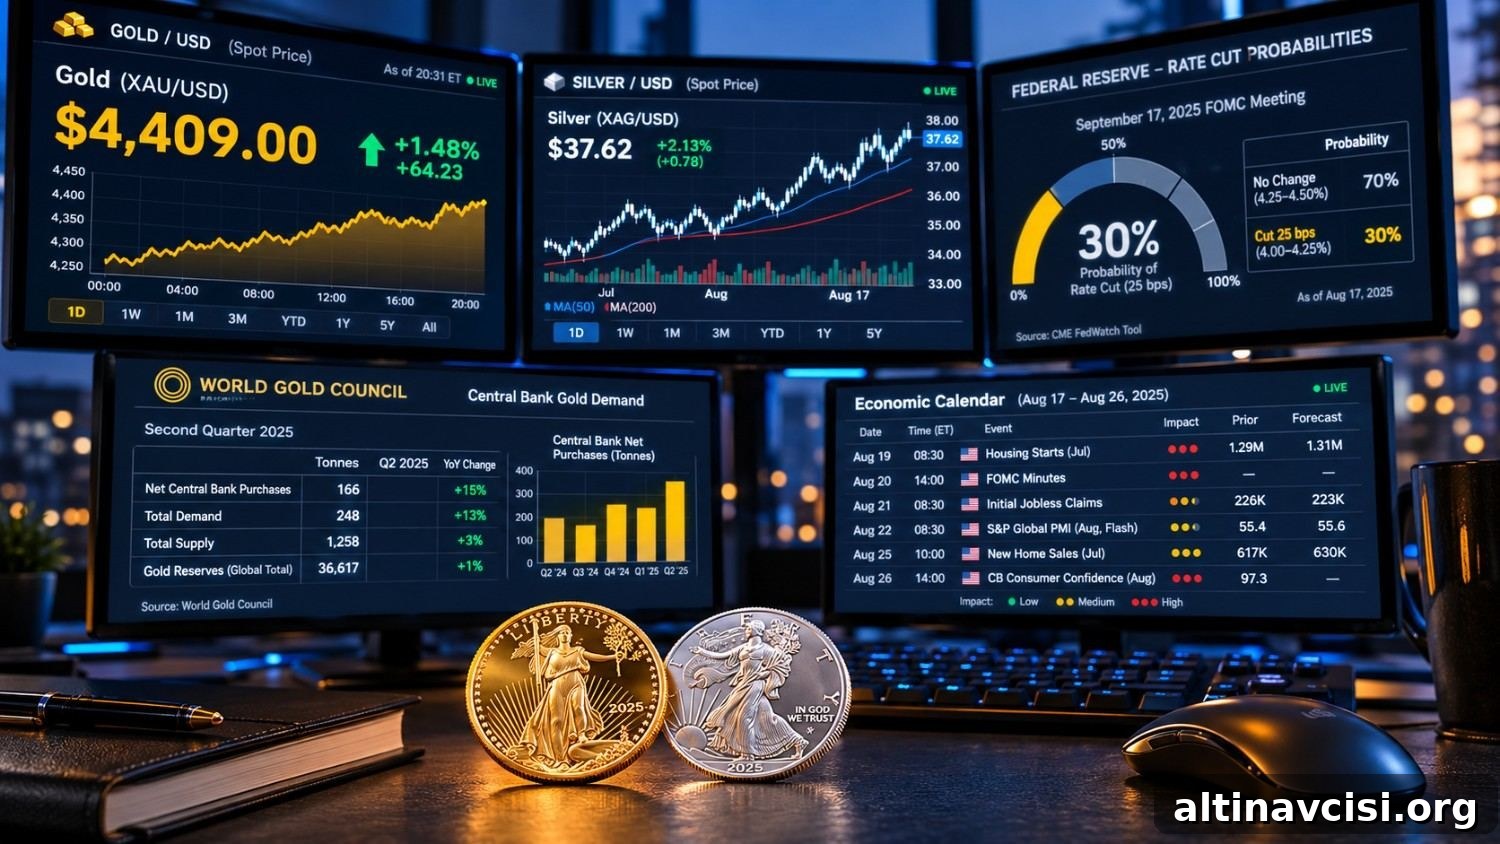
Gold is trading at $4,409 today and silver sits near $65.70. The relationship between Federal Reserve rate expectations and precious metals is shifting rapidly. Five distinct developments arrived this Monday morning, each from a different corner of the market, and all point in the same direction: lower rate-hike odds are supporting higher precious metals prices. Below is a clear, concise digest of what matters for gold and silver holders heading into a pivotal week.
Is the September Rate Hike Dead? Goldman Sachs Now Says Yes.
Goldman Sachs chief economist Jan Hatzius published a note on August 16 describing a September Federal Reserve rate hike as “extremely unlikely.” That view gained traction after three softer-than-expected data prints last week: tame July consumer prices, a 0.6% decline in retail sales (the first monthly drop in eight months), and an 8% fall in consumer sentiment for August. Those data points combined to push the market’s odds of a September hike down from roughly 55% last week to around 30% today.
The mechanism is straightforward. Gold does not yield interest, so when expectations for rate hikes drop, real yields tend to compress. Lower real yields reduce the opportunity cost of holding gold, making bullion more attractive. That transmission—from a research note and soft economic prints to lower real yields—helps explain why gold is trading at $4,409 this morning.
What Will Wednesday’s FOMC Minutes Reveal About Gold’s Next Move?
The Federal Reserve will release the minutes from its July 28–29 policy meeting on Wednesday at 2:00 p.m. ET. These minutes are likely the most important Fed-related publication for gold until Jackson Hole. The market already knows the Fed held rates in July at 3.50%–3.75%; the key question is how close the internal debate was.
A dovish tone in the minutes would support the market’s current view that the committee is leaning toward another hold, which would be positive for gold and could push prices toward the $4,500 area. Conversely, a hawkish tone would reduce the probability of a dovish outcome and could pressure gold lower. Traders see Wednesday as a binary risk event: the minutes will either reinforce the dovish repricing or reverse it. Recognizing that binary nature helps informed holders prepare rather than react impulsively.
Why Are Silver and Gold Moving at Different Speeds Today?
Silver gained 1.54% today while gold rose 0.74%. That divergence is not accidental and reflects two simultaneous forces affecting silver. First, the same rate-repricing that benefits gold also benefits silver: lower hike odds compress real yields and lift all non-yielding metals. Second, the gold-silver ratio has tightened from roughly 69 three weeks ago to about 67 today, indicating silver is narrowing its historical discount to gold. The long-run average ratio typically sits around 60 to 65.
It is important to note industrial demand dynamics. Solar manufacturers are actively reducing silver content in photovoltaic cells to cut costs even as installations are high. That means today’s silver outperformance is driven primarily by the monetary bid rather than by stronger industrial demand. Monetary-driven rallies can reverse quickly; industrial-driven deficits are typically more persistent. Silver holders should be mindful of that distinction when assessing risk.
What Does This Week’s Economic Calendar Mean for Gold Before Jackson Hole?
Gold faces a sequence of economic releases before the key Jackson Hole symposium on August 27–29. This week’s schedule includes Empire State Manufacturing (today), Housing Starts and Building Permits (Tuesday), Industrial Production (Tuesday), the FOMC minutes (Wednesday at 2:00 p.m. ET), the Philadelphia Fed and Jobless Claims (Thursday), and flash Purchasing Managers’ Indexes (Friday).
Each release either strengthens or weakens the case for a September hold. At present, gold’s price near $4,409 reflects a market priced for a hold. Federal Reserve Chair Jerome Powell has stated the Fed will not pre-announce decisions, so remarks from key central bankers at Jackson Hole will carry additional weight. This week’s data will shape expectations heading into those speeches, while Jackson Hole itself may deliver the clearest signal about the Fed’s next moves.
Central Banks Bought 288.9 Tonnes in Q2 — Into Falling Prices. Now Gold Has Recovered Above Where They Paid.
According to the World Gold Council’s Gold Demand Trends Q2 report, central banks purchased 288.9 tonnes of gold in the second quarter — the strongest Q2 on record and a 62% increase year over year. Major buyers included Poland and China. Notably, these purchases occurred while prices were falling by roughly 16% during that period.
Gold has since recovered and now trades near or above the average accumulation price paid by the largest sovereign buyers in Q2. The World Gold Council’s 2026 central bank survey found a majority of reserve managers expect global gold holdings to rise over the next 12 months. When institutions accumulate into weakness and then see prices recover, they tend to continue adding rather than exiting. That behavior creates a structural floor for prices, which is significant for medium- to long-term holders.
What Should Gold and Silver Holders Watch This Week?
The two events most likely to determine whether this week’s gains persist are Wednesday’s FOMC minutes and the Jackson Hole address on August 28. For gold, $4,500 is a clear resistance level while $4,310 serves as near-term support. For silver, monitor the gold-silver ratio closely: if it compresses below 65, silver may be overheating on a monetary bid and could face a sharp pullback. If the ratio remains above 65 while gold advances, the structural case for higher metals remains intact.
In every scenario, the same mechanism is at work: rate expectations influence real yields, which in turn affect non-yielding assets like gold and silver. Economic prints provide data to adjust those expectations; central bank commentary and minutes confirm the committee’s lean. Numbers can signal direction, but Fed officials confirm or deny it. Stay attentive to both data and Fed communication to position holdings appropriately.
Stay On Top of Gold & Silver Prices
Get important market alerts and timely commentary sent to your inbox.
SOURCES
1. World Gold Council — Gold Demand Trends Q2 2026 (central bank purchases summary).
2. Market commentary and economic releases cited include reporting on retail sales, consumer prices, and sentiment in August 2026. Data points referenced are those publicly reported by major economic statistical releases and industry research.
3. Market price references reflect prevailing spot quotes for gold and silver on the morning described in the article.
Disclaimer: This article is for informational purposes only and does not constitute investment advice. Past performance is not indicative of future results. Always consult a qualified financial advisor before making investment decisions.
You May Also Like:
- Zero Tankers Crossed Hormuz on Sunday. Oil Hit $89. Gold Barely Moved.
- Gold Rebounds to $4,392 as Sentiment Crashes and Inflation Expectations Shift.
- Gold Price and the September Fed Pivot: Key Data Prints Rewrote the Odds This Week.
- The Fed’s September Math Just Changed. Here’s What It Means for Gold.
- Jackson Hole Is 14 Days Away. What Central Bank Commentary Could Move Gold Most.
- Gold Hit a Two-Month High. Then It Pulled Back. The PPI Data That Caused Both Moves Is What Matters.