Gold Just Broke $4,000. The Mainstream Called the Debasement Trade Dead. They’re Wrong.
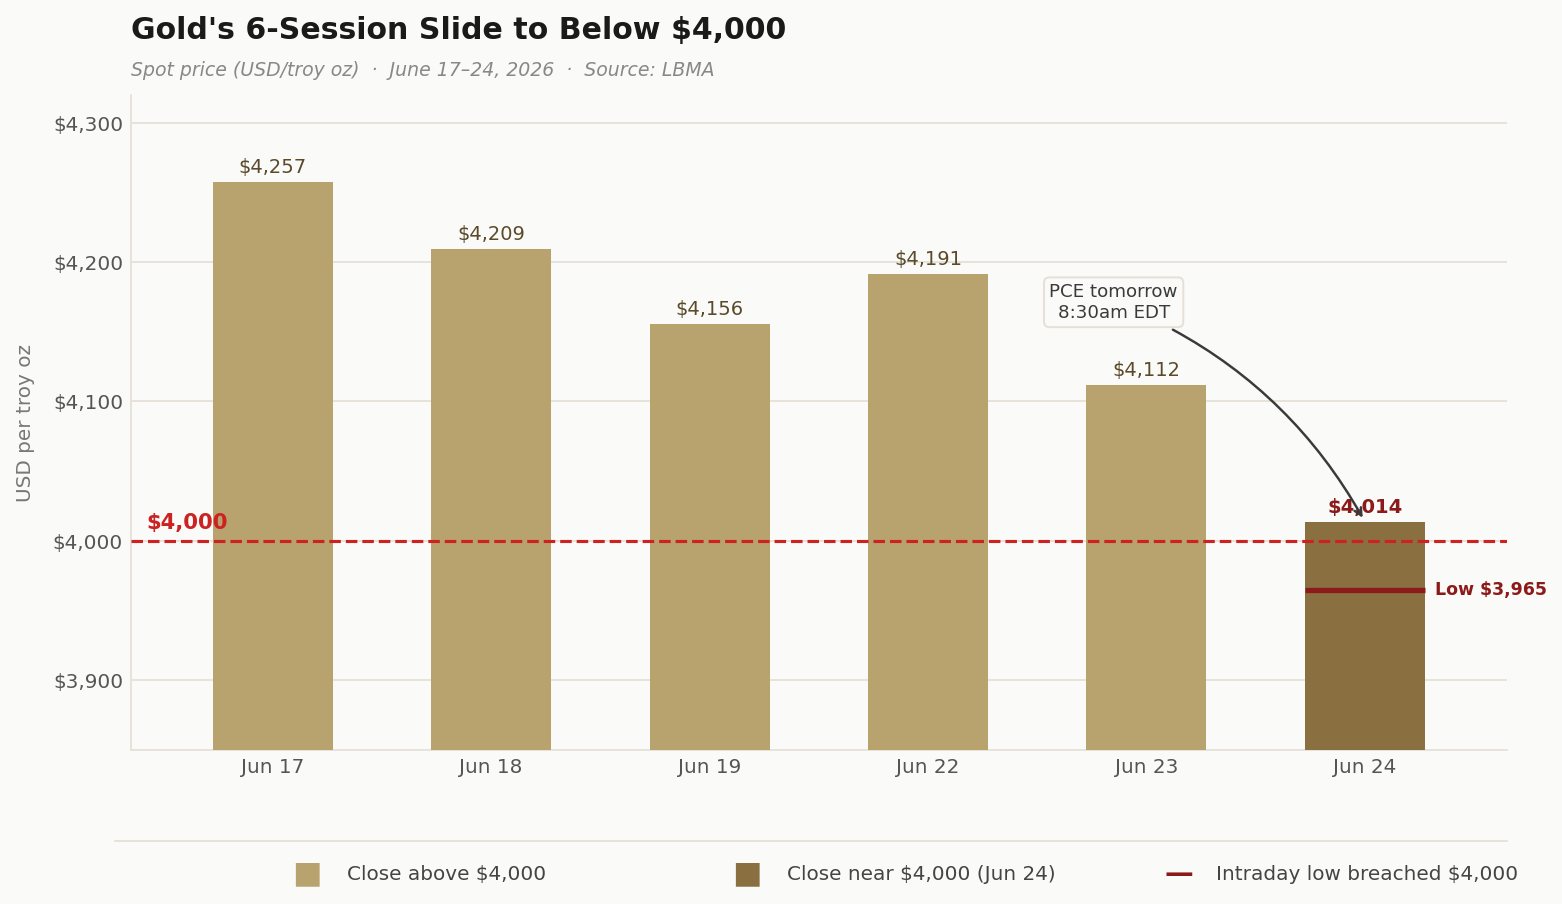
Gold broke below $4,000 per ounce today for the first time since November — and financial media has already written the obituary for the “debasement trade.” The thesis is simple: the Fed is hiking, real yields are positive, the dollar is at a 52-week high, and gold is down 28% from its January peak. Case closed, right?
Not quite. The selloff is real. The mechanism is textbook. And the structural case that drove gold from $2,600 to nearly $5,590 in just over a year remains entirely intact. Here is what you need to understand before tomorrow morning at 8:30.
Why is gold falling today?
The mechanism is not complicated. At the Federal Reserve’s June 17 meeting — Chair Kevin Warsh’s first — nine of nineteen FOMC officials projected at least one rate hike before year-end. As a result, the median dot plot shifted from 3.4% to 3.75–4.00%. Markets repriced quickly. According to CME FedWatch, roughly a two-thirds probability of at least one 25-basis-point hike by December is now priced in. Meanwhile, the US Dollar Index pushed above 100 for the first time since May 2025.
Specifically, real yields on 10-year Treasuries now sit near 2.2%, according to Federal Reserve TIPS data. That matters. When real yields rise, gold faces a genuine headwind. A 10-year inflation-protected yield at 2.2% is real competition for an asset that pays nothing. The paper market sold accordingly.
Gold also absorbed selling pressure from technology stocks. A sharp equity selloff prompted investors to trim positions across risk assets — including bullion — to cover losses elsewhere. However, that is algorithmic selling. It is not a verdict on gold’s long-term role as a store of value.

The Edge Every Investor Needs Smarter precious metals investing starts here. The Nuggets Newsletter brings you essential market insights, Fed updates, global trends, educational videos, and much more.
Did the structural case for gold change today?
No. And that distinction is the entire story.
The US fiscal deficit did not shrink today. Congress did not balance the budget. The Fed did not find a path to run the kind of Volcker-era tightening — rates at 15% — that would actually break the structural case for sound money. Instead, it signaled a possible 25-basis-point hike. That hike, if it arrives, would lift the federal funds rate to 3.75–4.00%. That is still well below the level required to outpace inflation when the Fed’s preferred price gauge is running at 3.8% and expected to hit 4.1% tomorrow.
That is the second corner most commentators are missing. A Fed that signals hikes but cannot fully execute them — not without breaking the housing market and the Treasury market — has not solved the monetary debasement problem. It is managing between a rock and a hard place. Historically, that is precisely the environment where long-term holders of physical gold and silver have been rewarded.
What does tomorrow’s PCE inflation data mean for gold?
May PCE inflation data drops Thursday at 8:30am EDT. Consensus expects a 4.1% year-over-year headline. If the print comes in hot, rate-hike expectations will likely extend. Gold may face continued near-term pressure as a result.
However, here is what most coverage will miss. May’s PCE captures a period when oil prices were still elevated from the Iran conflict. Since the US-Iran Memorandum of Understanding was signed in Switzerland in mid-June, energy prices have fallen sharply. Bank of America and UBS economists both note that June’s PCE — due in late July — is likely to show meaningful deceleration. Therefore, tomorrow’s print is largely a backward-looking artifact of a conflict that is now winding down.
The market may treat it as a forward signal. Long-term holders of physical metal should understand it as the latter.
Is the debasement trade really over?
Gold is down 28% from its January 28 peak near $5,590. Silver has fallen more than 50% from near $120. Those are real numbers. They are uncomfortable to hold through.
Still, what has not changed is the underlying case. The US is running fiscal deficits measured in trillions. Real wages are still losing ground to official inflation. The Fed’s preferred price gauge is running at nearly double its 2% target. And the structural argument that drove central banks worldwide to buy gold at record pace in 2024 and 2025 — the gradual erosion of confidence in dollar-denominated reserves — has not been resolved by a single dot plot shift.
Mainstream consensus found the exit sign after a 28% correction. That is what mainstream consensus does. The debasement trade is not over. It is on sale.
Stay On Top of Gold & Silver Prices
Get important market alerts sent straight to your inbox.
SOURCES
1. CME Group — FedWatch Tool: FOMC Rate Change Probabilities
2. Federal Reserve Bank of St. Louis (FRED) — 10-Year Treasury Inflation-Indexed Security
3. Federal Reserve — H.15 Selected Interest Rates, June 2026
4. Federal Reserve — FOMC Summary of Economic Projections, June 17, 2026
5. Morningstar — May PCE Expected to Show Rising Inflation
6. LBMA — Precious Metal Prices
Disclaimer: This article is for informational purposes only and does not constitute financial or investment advice. Always consult a qualified financial adviser before making investment decisions.