Gold and Silver Prices Today: Metals Slide as Central Banks Hold Firm
🌆 Evening News Nuggets | Today’s top stories for gold and silver investors
March 20th, 2026 | Brandon Sauerwein, Editor
After record highs above $5,000 gold and $100 silver, the reversal is here. Gold and silver prices today are under heavy pressure — and the macro story explains why.
Metals Slide as Central Banks Hold Firm
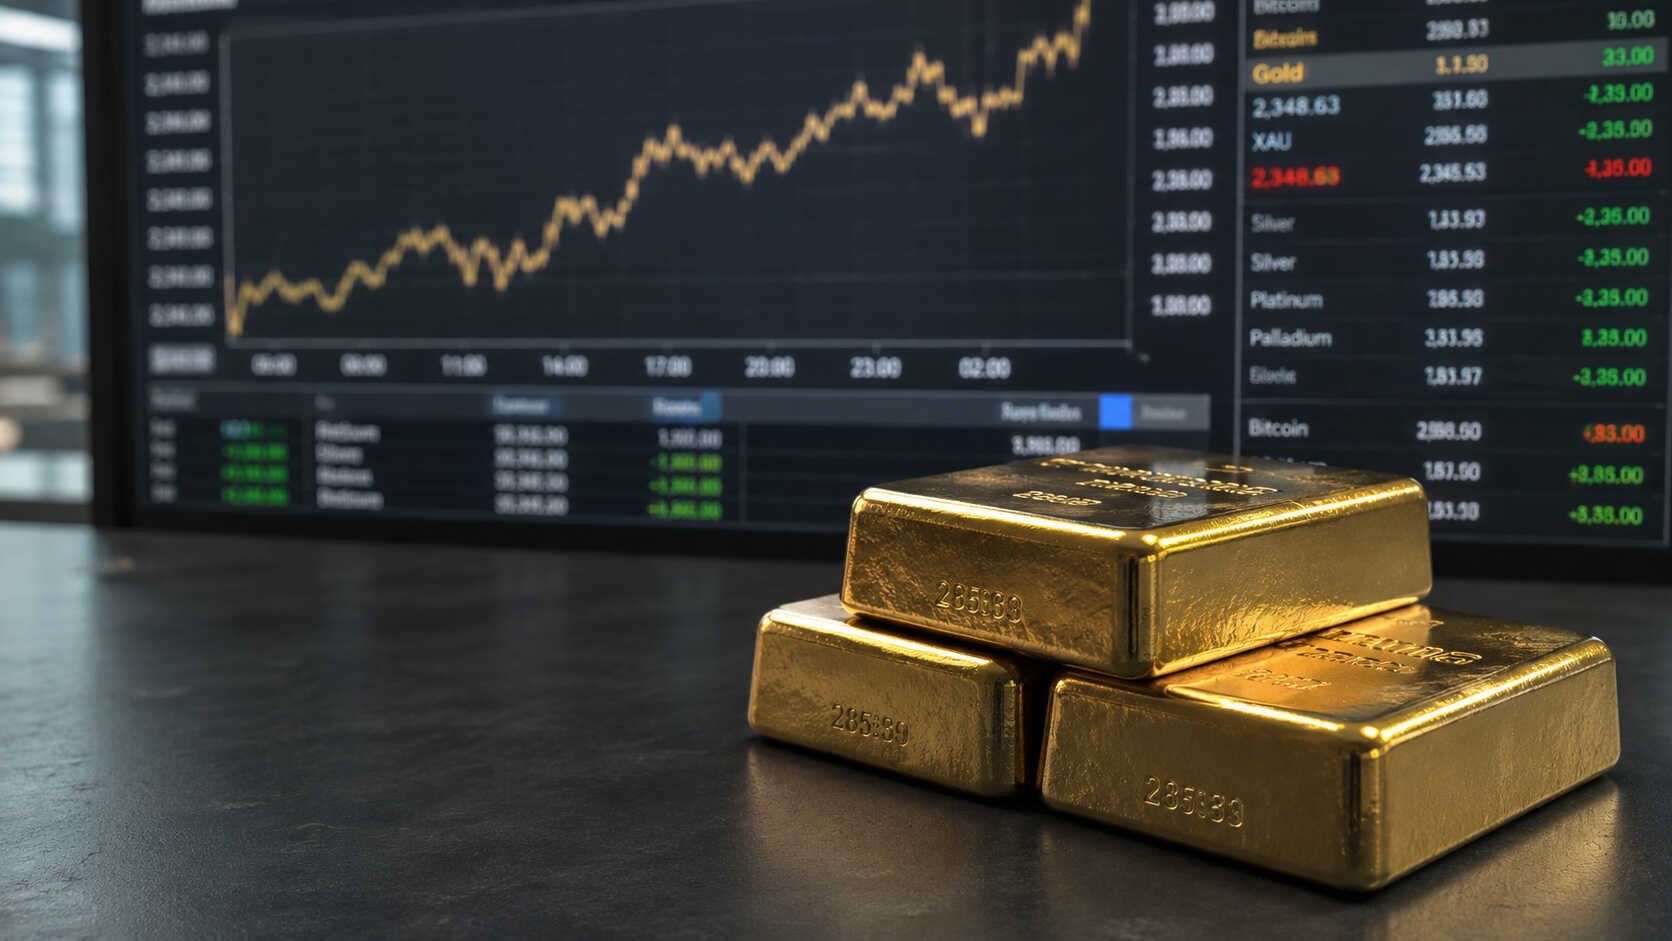
Gold and silver prices today are taking a sharp hit as the macro backdrop turns hostile. Gold is down roughly 3–4%, trading near $4,500 after touching record highs above $5,000 earlier this year. Silver is taking a harder hit — off as much as 7% on the day — with prices pulling back into the high $60s to low $80s range after its own historic run past $100.
Gold & Silver Prices YTD 2026 | Altinavcisi Altinavcisi Market Data Gold & Silver Prices: Year to Date 2026January 2 – March 20, 2026 · Source: StockCharts.com (CME Spot, EOD)
Gold Close $4,498.96 ▼ -3.26% on day Silver Close $67.99 ▼ -6.59% on day Daily Close — Jan 2 to Mar 20, 2026 Source: StockCharts.com · CME Spot (EOD) · For informational purposes only · AltinavcisiWhat’s Driving Gold and Silver Prices Today:
The Fed, ECB, BOJ, and BOE all held rates this week — but none of them blinked. The message from every major central bank was the same: rates are staying higher for longer. Markets are repricing accordingly.
The pressure points:
- The dollar is strengthening. DXY is pushing toward 99.6, up 0.4% on the day.
- The 10-year Treasury yield is climbing toward 4.39%. Rising yields raise the opportunity cost of holding non-yielding assets like gold.
- Strong dollar + rising yields = headwinds for metals. That’s the classic macro squeeze playing out in real time.
Is This a Gold Trend Reversal or Just a Positioning Flush?
This isn’t a trend reversal — it’s a positioning flush for gold and silver prices today. Gold ran hard into record territory. Crowded trades unwind fast when sentiment shifts. The 30-day drawdown is steep (-10% to -14%), but that’s the nature of parabolic moves. The gold-silver ratio sits around 62–67, meaning silver is still historically elevated relative to gold even after today’s selloff.
Gold-to-silver ratio, 2000–2026
Ounces of silver required to purchase one ounce of gold — monthly
Current (Mar 20, 2026) 63.00 Below 25-yr average 25-yr average — 2000–2026 Peak (silver undervalued signal) Trough (silver overvalued signal) Today (63.00) 25-yr avgSource: Macrotrends.net / StockCharts.com (gold/silver spot price ratio, monthly). Current reflects Mar 20, 2026 close of 63.00. A rising ratio means silver is undervalued relative to gold.
What Will Determine Gold and Silver's Next Move?
Whether yields stabilize or keep climbing. If the 10-year pushes meaningfully past 4.5%, metals could face additional short-term pressure. Physical demand at lower prices remains a key support level to monitor.
Stay On Top of Gold & Silver Prices
Get important market alerts sent straight to your inbox.