Bank of America Predicts Market Rebound: Gold Down 3% This Year

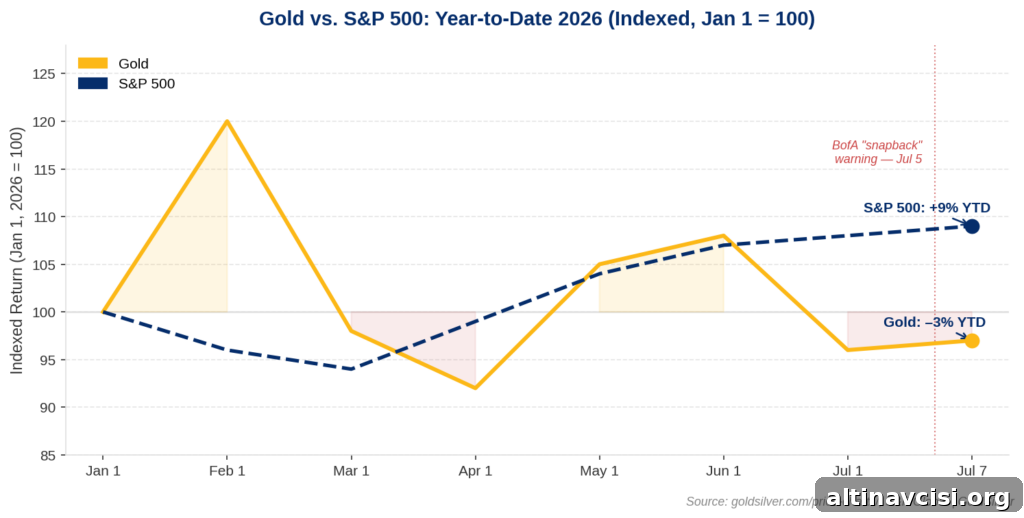
Bank of America has flagged current U.S. equity speculation as the most extreme it has seen since the 1999–2000 period — the moment just before gold entered its longest modern bull market. As of July 6, 2026, gold was trading near $4,160 (editor: verify current price), down roughly 3% year-to-date, while the S&P 500 is up about 9%. That divergence is not an accident; it is the set-up market observers should study closely.
What BofA Said
On July 5, 2026, Savita Subramanian at Bank of America reiterated her year-end S&P 500 target of 7,100 — roughly 5% below prevailing levels at the time. The note was explicit: “Our bear market signposts suggest speculation is hitting extreme levels as high multiple stocks have gapped up demonstrably, an event that has historically preceded a valuation ‘snapback.’”
This view is consistent with repeated warnings from the bank during the first half of 2026 that the S&P appeared priced beyond likely earnings. BofA also observed that no rate-hike cycle since 1999–2000 began with stocks at such elevated valuations — a precise historical comparison rather than a broad alarm.
The AI-led rally has concentrated capital into a narrow set of high-multiple technology names. Micron Technology, for example, rose about 242% year-to-date. Meanwhile, SK Hynix prepared a Nasdaq listing targeting roughly $29 billion on July 10 — a potentially record U.S. offering by a foreign company. That same concentration, BofA argues, is unlikely to widen indefinitely; historically, concentrated rallies have corrected.
The 1999 Parallel Gold Investors Should Know
That historical comparison points to a clear narrative. In August 1999, gold hit a two-decade low near $252 amid peak dot-com enthusiasm. Central banks were sellers, and media headlines questioned gold’s relevance as tech stocks returned 40% a year. Consensus favored equities over so-called “sound money.”
The Nasdaq peaked in March 2000 and the tech unwind followed. Gold, having already formed a low-based, began a sustained multi-year advance. From roughly $254 in 2001, gold climbed to $1,921 by September 2011 — a roughly 659% increase according to World Gold Council figures — despite two recessions, a global financial crisis, and prolonged periods of extremely low interest rates.
The mechanism is simple and repeatable: when earnings-based assets compress — either through valuation resets or a loss of speculative appetite — capital often shifts toward assets that do not depend on corporate earnings. Gold has no price-to-earnings multiple and needs no technological narrative to validate its value; it acts as a store of purchasing power outside the corporate-profit framework.
That dynamic is still relevant today. A surge in equity concentration makes gold relatively cheaper versus stocks and increases the potential for a reallocation when sentiment shifts.
Why Gold Is Down While Stocks Are Up
The 2026 disconnect has a straightforward technical explanation: real yields. When nominal interest rates rise faster than inflation expectations, assets that pay no yield — like gold — tend to face pressure. In June 2026, the Federal Reserve held the federal funds rate at 3.50–3.75%. The June Summary of Economic Projections showed nine of eighteen participants expected another 2026 rate increase. Gold declined roughly 12% in June, marking its worst monthly drop since October 2008.
Gold has shown signs of stabilization since that sell-off. For the week ending July 3, gold logged its first weekly gain since late May, up about 2.3%. The U.S. Bureau of Labor Statistics reported only 57,000 payrolls for June — well below the roughly 110,000 consensus estimate — and market odds for a September rate hike shifted lower after that payroll print.
Silver performed even better in that same week, rising roughly 6.7% versus gold’s 2.3%. The gold-to-silver ratio narrowed from above 72 in late June to about 67 by July 6, 2026, a move often interpreted as industrial demand or positioning anticipating easier policy — a development generally positive for holders of physical metal.
Importantly, gold’s decline does not imply the structural case for the metal has vanished. Rather, higher real yields and short-term speculative flows into AI and other tech names have temporarily diverted capital away from precious metals.
What the Sound-Money Lens Shows
Several major institutions published fresh gold analysis in early July 2026 and converged on a common conclusion: the Q2 sell-off altered entry prices but did not change the long-term thesis. The underlying structural pressures remain intact — persistent fiscal deficits, a growing national debt, and a Federal Reserve balancing inflation control with recession risk.
When equity speculation reaches extremes similar to 1999, gold’s price relative to stocks tends to move toward historic lows. Simply put, gold has not participated meaningfully in the AI-driven equity rally, making it relatively inexpensive versus equities — and insurance is typically cheapest when most investors believe they do not need it.
The Federal Open Market Committee’s minutes from the June 16–17 meeting were scheduled for release on Wednesday, July 8, 2026. Those minutes could clarify how committed the hawkish minority is to additional tightening. A more hawkish tone would push near-term gold pressure higher; a dovish tilt could reopen the path toward higher nominal gold levels.
Bank of America’s central question is worth considering: if U.S. equities are as expensive today as they were in 1999, and gold sits near generational lows relative to stocks, what might follow when sentiment shifts? History offers one answer — gold rose dramatically after the dot-com peak — and while circumstances today are different, the mechanism that drove that reallocation remains relevant.
Stay On Top of Gold & Silver Prices
Get important market alerts sent straight to your inbox.
SOURCES
1. Fortune — BofA Stock Market Warning, Speculation Hitting Extreme Levels, July 5, 2026
2. CNBC — Gold Prices Set for First Weekly Rise in a Month as Fed Rate Hike Bets Recede, July 3, 2026
3. GoldSilver — Live Gold and Silver Spot Prices, July 6, 2026
4. Federal Reserve — FOMC Meeting Calendar and June 2026 Summary of Economic Projections
5. Bureau of Labor Statistics — Employment Situation Summary, June 2026
6. CME Group — FedWatch Tool, September 2026 Rate Probability, July 6, 2026
7. Trading Economics — Gold Price Historical Data, July 2026
8. CNBC — Gold Faces Biggest Monthly Drop Since Late 2008 on Hawkish Fed Stance, June 30, 2026
Disclaimer: This article is for informational purposes only and does not constitute financial or investment advice. Always consult a qualified financial adviser before making investment decisions.
You May Also Like:
- Warsh Sat Out the Dot Plot. The FOMC Minutes Drop Wednesday.
- Gold Digest: Five Institutions Just Said the Same Thing About the Selloff
- Gold Hits 3-Week High as Fed Hike Odds Halve on Jobs Miss
- The Jobs Report Missed. The Unemployment Rate Fell Anyway. Gold Didn’t Buy It.
- Gold Jumps 2.5%, Silver Surges 3.85% as Rate-Hike Bets Unwind Ahead of Jobs Report
- Warsh Called Inflation “Too High.” He Also Said the Risk Is Fading. Gold Noticed.
- ADP Missed. Gold Shrugged. Warsh Is Live in Sintra Right Now.
Popular Topics
Picked from the archive
-
01
 Topics
Could Gold Hit $5,000? Goldman Sachs Explains
-
02
Topics
Why Boring Gold Outperformed Nasdaq by 30% in 5 Years
-
03
Topics
Gold vs Savings Account: Which Investment Beats Inflation Now?
-
04
Topics
Gold Rebounds from Two-Week Low Ahead of Trump-Zelenskiy Summit
-
05
Topics
Gold Prices Rise for Seventh Week as Jobs Data Goes Dark
-
06
Topics
Gold Remonetization: 6 Forces Reviving Gold as Money
-
07
Topics
Gold vs Silver: Why Gold Stabilizes Markets, Silver Amplifies
-
08
Topics
Gold Breaks Through $4,400 as Silver Targets $70