Gold Surges Past $4,130: What It Means for Investors
Key Takeaways:
- Gold rebounded on October 15 after a steep, inflation-driven selloff the day before.
- September’s U.S. inflation reading was higher than many expected, but shifts in bond yields and the dollar quickly altered market direction.
- Short-term price swings matter for transaction timing, but they do not by themselves overturn a long-term plan for physical ownership.
On October 15, gold recovered above $4,130 following a sharp inflation-driven decline the prior day. At 12:30 UTC that day, GoldSilver’s intraday spot reading showed $4,131.41 and silver was near $56.38. These were intraday observations rather than official closing prices.
The market had been especially volatile the previous session. On October 14 gold closed at $4,105.48, a drop of 1.3% for the day. During that session, two consecutive intraday readings moved lower by a combined $60.04 in about 15 minutes. By 12:45 UTC on October 15 the metal had retraced much of that loss, trading around $4,145.99 — roughly 0.99% above the October 14 close. These swings reflect how quickly expectations can shift when inflation data, yields and currency flows all change in short order.
In practical terms, the rebound alters the immediate purchase price for anyone buying bullion, but it does not automatically change an investor’s long-term decision about holding physical gold.
Why Did Gold Rebound After the Inflation Selloff?
The catalyst for the prior-day selling was the U.S. Consumer Price Index report for September. Consumer prices rose 0.6% for the month and 3.7% year‑over‑year, while core CPI, which excludes food and energy, was up about 2.6% on an annual basis. Higher-than-expected inflation can complicate the Federal Reserve’s policy path and prompt investors to price in a longer period of elevated interest rates — a development that typically weighs on gold because bullion does not yield interest.
Yet market dynamics shifted during the following session. Treasury yields eased from their intraday highs and the U.S. dollar weakened amid broader financial-market jitters. Those moves reduced the opportunity cost of holding non‑yielding bullion and also made dollar-priced gold more affordable to overseas buyers. As a result, the price reversed some earlier losses and moved higher. These relationships — between yields, the dollar and gold — help explain the rapid repricing, but none guarantees a sustained trend.
The episode highlights how quickly markets can re-evaluate expectations about inflation, growth and monetary policy. Volatility indicators such as the Gold Volatility Index (GVZ) and short-term yield movements often show how market participants are positioning, but they do not eliminate fundamental uncertainty.
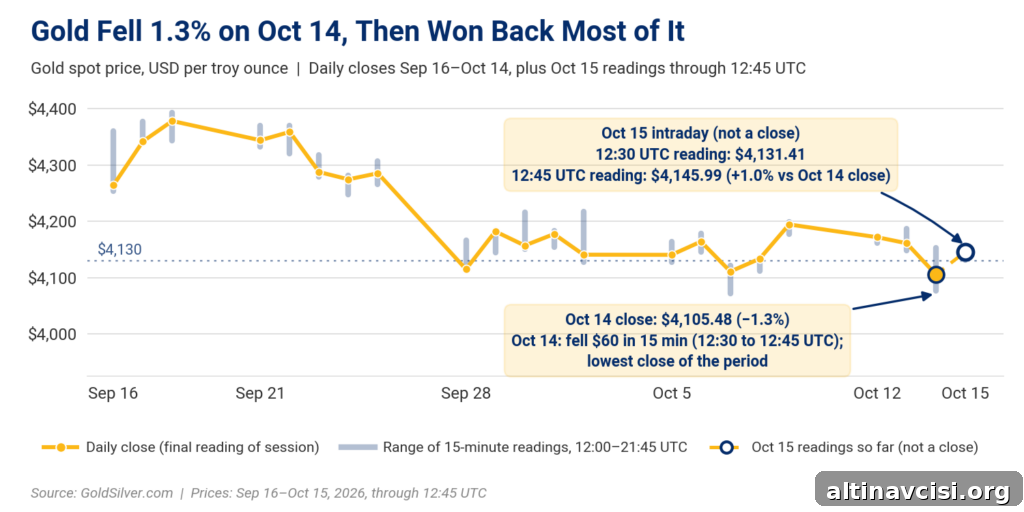
Intraday readings show gold closed October 14 at $4,105.48 and recovered to about $4,145.99 by 12:45 UTC on October 15. October 15 figures cited are intraday observations, not period closes.
What Does the Reversal Mean for Physical Gold Owners?
Short-term traders may treat a near-1% move as an actionable event. For long-term holders of physical bullion, the questions are different. Physical gold is a finite asset that does not depend on any counterparty promise; many investors hold it for diversification and to help preserve purchasing power over multi-year horizons.
That said, gold is not an automatic hedge that moves in lockstep with headline inflation. Prices can and do fall sharply even when consumer inflation remains elevated — the October 14 selloff serves as a clear example. Owners should therefore separate market noise from meaningful changes in their financial circumstances.
Transaction costs also matter for physical bullion: dealers charge premiums above spot when selling and a spread when buying back. Storage and custody arrangements are consequential as well. Allocated storage, which designates specific bars or coins to an owner, differs materially from arrangements that represent a claim against a provider. When calculating whether to buy, sell or hold, investors should consider total acquisition cost, likely resale spreads, insurance, security and the legal terms of any vaulting agreement.
Stay On Top of Gold & Silver Prices
Get important market alerts and concise analysis delivered to your inbox.
Live price widgets and subscription forms have been removed from this version. For the latest intraday quotes, consult your preferred market data provider.
Does the Rebound Change the Decision to Buy Gold?
A price rebound changes the entry point for new purchases, but it should not be the sole factor in deciding whether physical gold is appropriate. Investors should evaluate whether bullion fits their objectives, time horizon and liquidity needs, and should factor in premiums, dealer spreads, storage costs and insurance when assessing total cost.
If your goals or liquidity needs have shifted, it may make sense to adjust holdings. But reacting to a single intraday reversal often does more harm than good for long-term strategies. Effective decisions are grounded in clear objectives, an understanding of transaction mechanics, and a view of how gold complements other assets within a portfolio.
What Should Gold Owners Watch Next?
Key indicators to monitor include upcoming inflation releases, Federal Reserve communications, Treasury yields and currency movements. Real yields — nominal rates adjusted for inflation expectations — are especially informative because they capture the opportunity cost of holding non‑yielding assets like gold.
Investors need not trade every time those indicators shift. Regular portfolio reviews that address allocation, transaction costs, liquidity and storage arrangements typically produce better outcomes than attempting to time short-term price swings. The October 15 rebound erased much of the prior session’s decline, but the larger questions about inflation, rates and purchasing power remain unresolved. The price can change quickly; a thoughtful ownership plan does not have to.
Sources
1. U.S. Bureau of Labor Statistics — Consumer Price Index, September 2026 (release dated October 14, 2026).
2. GoldSilver — Intraday spot price charts and historical price data for October 14–15, 2026.
Disclaimer: This article is informational only and does not constitute investment advice. Past performance is not indicative of future results. Consult a qualified financial advisor before making investment decisions.
You May Also Like:
- How 3.7% Inflation Impacts Wealth Preservation
- Gold and Silver Dip on a Hot CPI Report
- Currency Swing Erases Gold’s Brief Dip
- Short-Term Pressure Pushes Gold Down
- Squeezed at the Pump, Steady in the Vault
- Fed Governor Blames AI Chips for Inflation, Silver Falls
- Oil Jumps on Supply Shocks — Why Didn’t Gold Follow?
- China’s Large Gold Purchase and the Short-Term Price Reaction
- Why Silver Is Falling Faster Than Gold Today
Popular Topics
Picked from the archive
-
01
 Topics
Weaker Dollar, Falling Gold: A Bullish Signal
-
02
Topics
Gold Drops 22% Like 2022: Why the Floor Is Different
-
03
Topics
Municipal Bonds Reach 15-Year Record: Why Gold Is Unaffected
-
04
Topics
Gold, Silver Steady as Bessent Seeks Hormuz Deal; JOLTS Falls
-
05
Topics
Gold Prices Pull Back Ahead of Fed Meeting
-
06
Topics
Will Policy Reversal Move Gold? Conflict Pressure Index Insight
-
07
Topics
Gold Falls to Two-Month Low as Yields Rise, Not Iran
-
08
Topics
Silver Price Outlook Sep 2026: Hike Priced In, Positioning Lags