Gold ETF Outflows From One Region, Global Buyers Fill the Gap
Gold climbed 0.96% today to $4,370.27 an ounce, while silver rose 1.37% to $64.95. Both metals recovered from two-week lows as investors awaited this week’s labor-market data. But a more telling snapshot comes from earlier in the year: during the first half of 2026, gold ETF investors in one region sold heavily while investors elsewhere were net buyers.
Which Region Sold Gold ETFs in 2026?
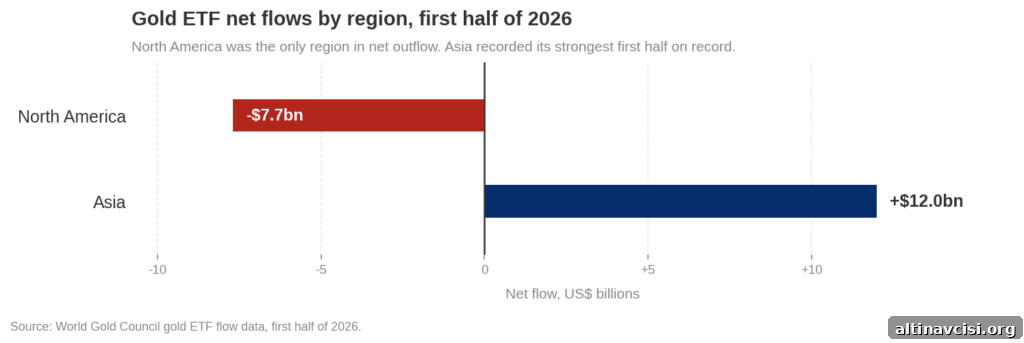
North America was the standout seller — and it was singular in that role. In the first half of 2026, North American-listed gold ETFs recorded the only regional net outflow, shedding around $7.7 billion, according to World Gold Council ETF flow data. Over the same period, Asian-listed funds saw inflows near $12 billion, marking Asia’s strongest first half on record for gold ETF purchases.
This split does not reflect a global disagreement about gold’s prospects. Rather, it shows one region stepping away from an ETF structure while others stepped into it during the same price decline.
July narrowed the gap, but did not erase it. Global gold ETFs added about $3 billion in July, with total holdings recovering roughly 23 tonnes to reach 4,068 tonnes — still below the record 4,176 tonnes recorded on 27 February 2026. European funds led July’s inflows. North America finally turned modestly positive for the month, by about $71 million (roughly a third of a tonne), but the World Gold Council noted this had little impact on the region’s year-to-date deficit.
Through the end of July, cumulative global inflows stood at roughly $11 billion, or 39 tonnes, while North America remained the lone region in the red.
One note on timing: July is the most recent month published by the World Gold Council at the time of writing; August figures were not yet available, so the analysis focuses on flows through July.
What Is the Disadvantage of Gold ETFs?
A gold ETF share represents a claim on gold held by a custodian within a fund structure. That structure delivers important benefits: liquidity, low cost, and close tracking of the spot price. For many investors these features make ETFs a convenient way to gain exposure to gold.
However, ETF ownership is not the same as owning physical metal outright. A coin or a bar held in your name is direct property with no counterparty risk — its value does not depend on an issuer’s creditworthiness. By contrast, mining stocks carry equity risk, and futures contracts introduce leverage and roll costs. Physical metal brings storage and insurance costs, but not issuer risk.
So when a region withdraws from ETFs, the key question is not simply whether those investors have turned bearish. The more important question is whether they replaced ETF holdings with physical metal held elsewhere, or whether they liquidated exposure to gold entirely.

The Edge Every Investor Needs
Smarter precious metals investing starts here. The Nuggets Newsletter brings essential market insights, Fed updates, global trends, educational videos, and more.
Are Investors Moving From Gold ETFs to Physical Bars?
There is evidence some investors are shifting from gold-backed ETFs into physical allocated or segregated bars — particularly wealthy clients using private vault operators in London and Switzerland, according to press reports. That trend appears to involve different investor groups than those selling North American ETFs: high-net-worth individuals choosing direct ownership and custody arrangements, while other investors continue to buy ETF shares in different regions.
These are separate datasets measured in different ways, so they should not be conflated. Still, both lines of evidence point away from North America as the source of growing physical demand: Asia and Europe have been taking the ETF inflows and vaults in private markets report rising demand for allocated storage.
Is It Better to Invest in Physical Gold or an ETF?
The right choice depends on an investor’s goals. ETFs are liquid, cost-efficient, and convenient for trading or portfolio allocation. Physical gold can offer peace of mind through direct ownership and no counterparty risk, albeit with storage and insurance costs.
Macro factors also matter. As of 31 August, the 10-year inflation-indexed U.S. Treasury yielded about 2.44%, a positive real return available on a government bond. That level of real yield helps explain some of gold’s weakness into late August, because gold pays no income and higher real rates raise the opportunity cost of holding it. The Federal Reserve had maintained its policy range at 3.50%–3.75% since December 2025, and market attention was focused on whether the next FOMC move would be a hike or a cut — a dynamic that, in the near term, does not necessarily favor gold.
But the structural case for gold is not based on real yields staying negative. It rests on longer-term concerns about fiscal deficits and money supply growth and what those trends mean for purchasing power over a decade or more. That is a slower, more enduring rationale that can coexist with shorter-term volatility driven by interest rates and real yields.
What the Regional Split Actually Tells You
Allocating to gold is effectively two separate decisions: how much of your portfolio to allocate, and in what form to hold that allocation. The first half of 2026 suggests many North American investors revisited the allocation decision and reduced ETF positions. At the same time, evidence from private vaults indicates other investors responded to the form question by preferring allocated or segregated physical holdings.
If your main concern is the form of storage — how allocated or segregated storage works and what it costs — consult your preferred custodian or storage provider for detailed, current information tailored to your needs. Current spot prices and live charts are also widely available from market-price services and exchanges.
Stay On Top of Gold & Silver Prices
Get important market alerts sent straight to your inbox.
SOURCES
1. World Gold Council — Gold ETF Holdings & Inflows, first-half 2026 regional flows (published 8 July 2026; accessed 2 September 2026)
2. Federal Reserve Bank of St. Louis (FRED) — 10-year inflation-indexed Treasury yield (data as of 31 August 2026)
3. World Gold Council — Gold ETF Flows, July 2026 (published 6 August 2026; accessed 2 September 2026)
4. Board of Governors of the Federal Reserve System — FOMC meeting calendars, 2026 (accessed 2 September 2026)
5. Financial Times — reporting on private vault capacity and demand for allocated bars (week of 24 August 2026)
6. Federal Reserve Bank of St. Louis (FRED) — Federal Funds Target Range, Upper Limit (data as of 2 September 2026)
7. GoldSilver — Live gold and silver price charts (2 September 2026)
Disclaimer: This article is for informational purposes only and does not constitute investment advice. Past performance is not indicative of future results. Consult a qualified financial advisor before making investment decisions.
You May Also Like:
- Gold’s Sellers Are Trading Weeks. Its Buyers Are Counting Decades.
- The Iran War Just Got Worse. Gold Barely Noticed.
- Silver Is Falling Faster Than Gold Today. Its Deficit Didn’t Change.
- Wall Street Keeps Buying Gold. Washington Keeps Sending Mixed Signals.
- Iran’s Gold Sector Just Got Named in U.S. Sanctions. Gold Is Selling Off Anyway.
- Hike Odds Doubled This Week. Real Yields Didn’t.
- COMEX Registered Gold Just Fell Below 15 Million Ounces. It’s Still Refilling.
Popular Topics
Picked from the archive
-
01
 Topics
Five Gold Signals This Week Unrelated to Today’s Gold Price
-
02
Topics
How Silver Powers AI Models and Infrastructure
-
03
Topics
Gold Remonetization: 6 Forces Reviving Gold as Money
-
04
Topics
Why Gold Rallyed Despite Lower Jobless Claims: 4 Key Signals
-
05
Topics
What Really Happens When You Sell Gold Without Taking Delivery
-
06
Topics
Key Indicator to Watch for Gold Ahead of Fed Decision
-
07
Topics
Federal Reserve Confirms 9-3 Vote Split, Signals Major Shift
-
08
Topics
Peak Gold: Why Gold Mine Output Can’t Meet Demand