PCE Inflation Hits 4.1%: Why Gold Prices Rose
Key Takeaways
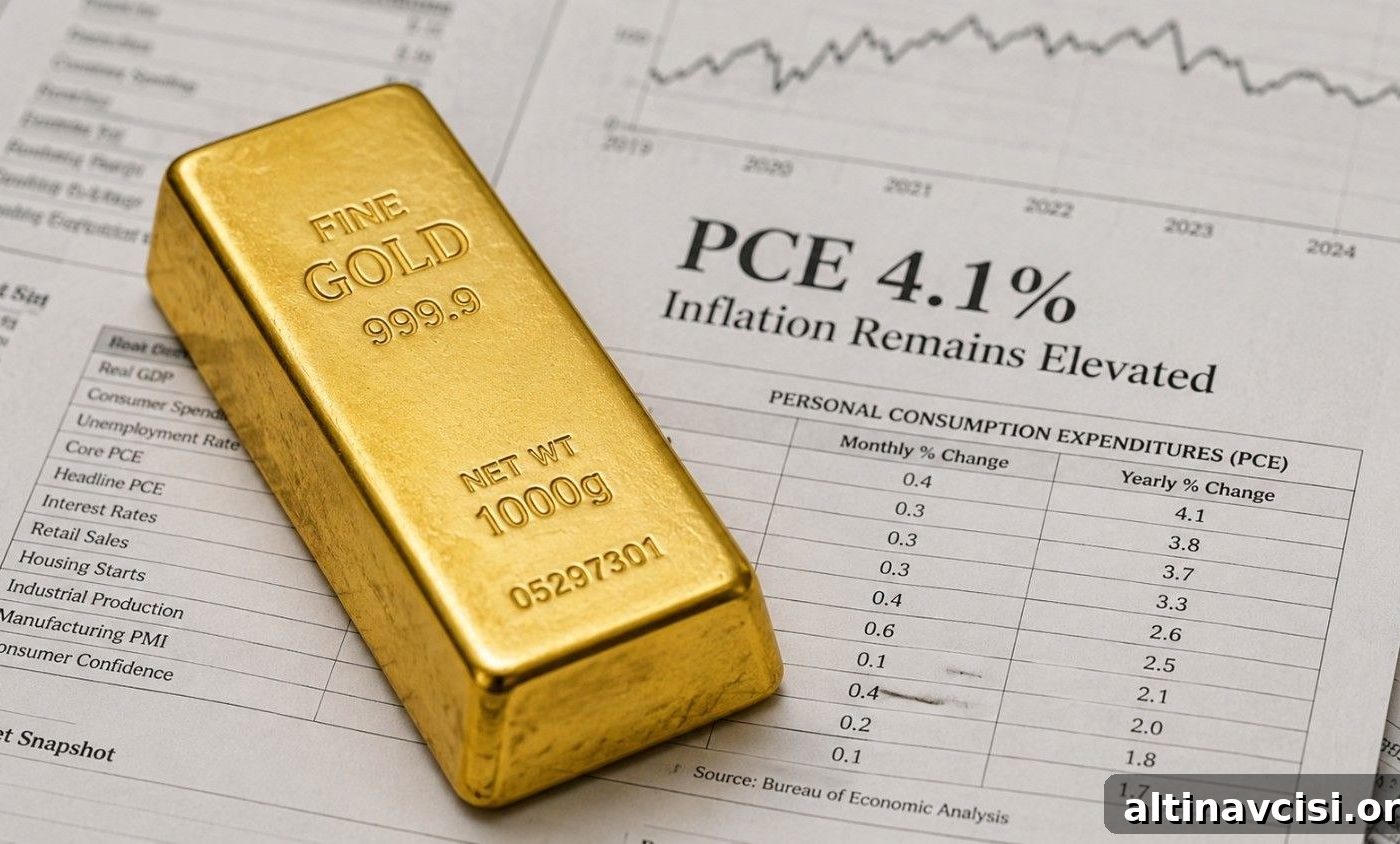
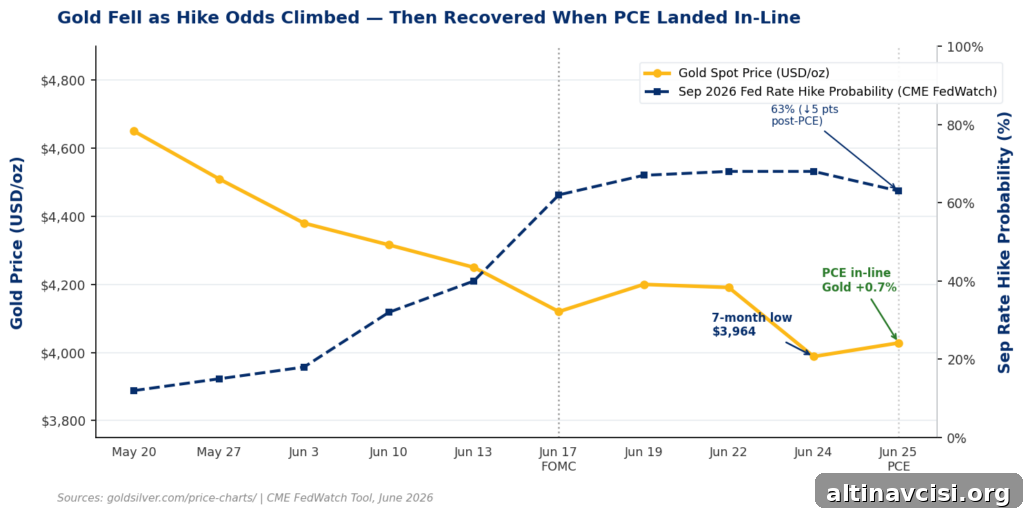
- May PCE inflation printed 4.1% headline and 3.4% core — matching consensus — and gold recovered above $4,000 after a midweek low near $3,964.
- Gold’s rebound on a hot-but-expected inflation reading illustrates how “priced in” expectations can remove selling pressure when data simply confirms what markets already anticipated.
- Gold effectively operates as two markets: rate-sensitive paper traders (short-term horizon) and long-term central bank buyers holding physical ounces. Central banks purchased 244 tonnes net in Q1 2026.
- Major institutional year-end targets — Goldman $4,900, JPMorgan $6,000, Wells Fargo $6,100–$6,300 — remain well above current spot levels, despite recent volatility.
- Physical holders of gold experienced no structural change: margin calls, fund redemptions, and counterparty risks affect paper positions, not physical metal stored outside the financial plumbing.
Gold fell toward its lowest level since November 2025 over several days, then climbed after the U.S. government confirmed inflation remains elevated. Despite a year-over-year PCE reading of 4.1% — the fastest pace in more than three years — spot gold rose above $4,000 on June 25, 2026. That apparent contradiction highlights a market dynamic worth understanding: when a risk is already priced into asset values, a confirming data release often eases selling pressure rather than intensifies it.
By mid-morning on June 25, spot gold was trading above $4,000 per ounce, about 0.7% higher than Wednesday’s close. The Bureau of Economic Analysis reported the Personal Consumption Expenditures (PCE) price index up 4.1% year-over-year in May; core PCE, excluding food and energy, rose to 3.4% from April’s 3.3%, in line with consensus expectations. Because these figures matched what markets were already pricing, the immediate downward pressure on gold dissipated and buyers re-entered the market.
What Does “Priced In” Actually Mean for Gold?
When traders say a risk is “priced in,” they mean market prices already reflect the expectation. In gold’s recent move, that repricing happened in the days following the Federal Reserve’s June 17 meeting. The Fed’s updated projections showed some committee members anticipating at least one rate hike in 2026, which pushed the dollar higher and prompted paper-market selling in gold.
After the FOMC meeting, the CME FedWatch Tool indicated a sizable probability of a September rate increase. Traders adjusted short-term positions to account for that risk: futures, ETFs, and macro funds reduced exposure. As traders moved to reflect possible additional tightening, gold briefly tested a seven-month low near $3,964.
Because markets had already accommodated the possibility of further hikes, the May PCE release — while “hot” relative to the Fed’s 2% target — did not introduce a new downside shock. A confirming data point removed marginal sellers who had sold in anticipation of worse outcomes. The dollar eased, yields slipped modestly, and gold attracted buyers again.
Why Are Two Separate Gold Markets Moving in Opposite Directions?
Gold now behaves like two parallel markets with distinct drivers. One is the rate-sensitive paper market: futures traders, ETF managers, and hedge funds that treat gold as a tactical trade tied to interest-rate expectations. Their horizons are measured in days and weeks. The other is the market for physical gold — largely central banks and long-term reserve managers — which operates on a multi-year to multi-decade timescale.
Central banks are accumulating physical gold steadily. Data from the World Gold Council showed global central-bank net purchases of 244 tonnes in Q1 2026, up from 208 tonnes in Q4 2025, and reports indicate the People’s Bank of China has continued to add reserves month after month. These buyers did not react to the intraday lows in paper markets; they are buying for reserve diversification and long-term preservation of value.
Paper traders can create volatility by rapidly adjusting exposure to rate expectations. Physical buyers act as structural support, absorbing that selling pressure when prices dip. That dynamic provided a de facto floor near $3,900 during this week’s moves.
Investor implication: Markets often sell first and ask questions later. When the paper market has already priced a rate risk, a data release that confirms that risk tends to remove marginal sellers rather than trigger further exits. Central banks buying hundreds of tonnes per quarter are not waiting for favorable headlines — they buy through volatility.
What Are Major Banks Forecasting for Gold?
Large institutions have not abandoned their medium- and long-term gold outlooks despite recent short-term volatility. Goldman Sachs revised its year-end 2026 target to $4,900 per ounce on June 19 after removing planned 2026 rate cuts from its model. JPMorgan has maintained a $6,000 year-end target, emphasizing the significance of central-bank demand over short-term rate moves. Wells Fargo continues to forecast a $6,100–$6,300 range. These targets sit comfortably above current spot prices, reflecting a broad divergence between short-term price action and longer-term expectations.
What Does Today’s PCE Mean If You Own Physical Gold?
For physical holders, the midweek dip to $3,964 was a market quote, not a structural threat. Physical ounces held outside the banking system do not face margin calls, fund redemption pressures, or counterparty settlement risk. That protection is the key reason many investors include physical metal in a diversified allocation.
Understanding the mechanics — why paper markets can be volatile and why central-bank demand offers steady support — can help long-term holders remain disciplined through short-term fluctuation. Today’s PCE shows inflation remains well above the Fed’s target and underscores the slow erosion of purchasing power that makes physical gold a relevant long-term hedge. The paper market took a few days to work through rate expectations; the physical market barely changed its course.
The Edge Every Investor NeedsSmarter precious-metals investing begins with clear, timely insight. Subscribe to concise market notes that explain price drivers, Fed moves, and structural demand forces.
Stay On Top of Gold & Silver Prices
Receive timely market alerts and analysis delivered to your inbox.
SOURCES
1. Bureau of Economic Analysis — Personal Income and Outlays, May 2026
2. Federal Reserve — FOMC Statement and Summary of Economic Projections, June 17, 2026
3. CME Group — FedWatch Tool, June 2026
4. World Gold Council — Gold Demand Trends Q1 2026, April 2026
5. GoldSilver — Gold & Silver Spot Prices, June 25, 2026
6. CNBC coverage of May PCE, June 25, 2026
7. J.P. Morgan Global Research — Gold price insights for 2026 and 2027
Disclaimer: This article is for informational purposes only and does not constitute financial or investment advice. Always consult a qualified financial adviser before making investment decisions.
You May Also Like:
- 298 Tonnes of ETF Gold Is Underwater. Central Banks Aren’t.
- Hawkish Fed, Gold Below $4,000, Silver Below $60 — and a Market That Disagrees.
- Gold Just Broke $4,000. The Mainstream Called the Debasement Trade Dead. They’re Wrong.
- Two Things Are Hitting Gold Simultaneously. Only One Is About Gold.
- Why Is Silver Down 5%? The Gold-Silver Ratio Explains.
- BofA Says Three Rate Hikes. Silver Just Priced In the First One.
- Iran Deal. Oil Falling. A PM Out. Gold Still Above $4,100.
Popular Topics
Picked from the archive
-
01
 Topics
Why BRICS Nations Are Stockpiling Gold
-
02
Topics
Gold Prices Fall to Seven-Month Low as Geopolitical Fear Fades
-
03
Topics
CPI-Adjusted Silver vs Spot Price: What the Ratio Reveals
-
04
Topics
Shutdown Nears Deadline as Gold Soars 12% in September
-
05
Topics
Gold Price Up 1.5% as ADP, ISM and Beige Book Weigh on Fed
-
06
Topics
Silver vs Gold 2026-2031: 5-Year Investment Outlook
-
07
Topics
US Jobless Claims Jump to 3-Month High, Point to Labor Softening
-
08
Topics
How Fed Pause and Rising PPI Affect Gold Prices