Gold-to-Silver Ratio Widens: Why Investors Misread It
Gold and silver market update — May 4, 2026
Key Takeaways
- The gold-silver ratio has widened to 62.05:1. Since April 22, silver has fallen roughly 7% while gold has fallen about 4%, so silver is underperforming, not leading.
- This widening looks like a short-term cyclical reaction: markets are pricing in reduced geopolitical risk that trims silver’s industrial risk premium. The structural backdrop — a multi-year supply deficit, record Chinese demand, and Basel III regulatory support — remains intact.
- For sound-money investors, a Fed that remains on hold (suppressing real yields) is a major, often overlooked tailwind for silver. At 62:1, silver appears to have more upside versus gold if the monetary case reasserts itself.
Two weeks ago silver was behaving as many sound-money investors expected: the gold-silver ratio was compressing toward 60:1 and silver was outperforming gold as both metals retreated from the Iran-war peaks. That theme had momentum.
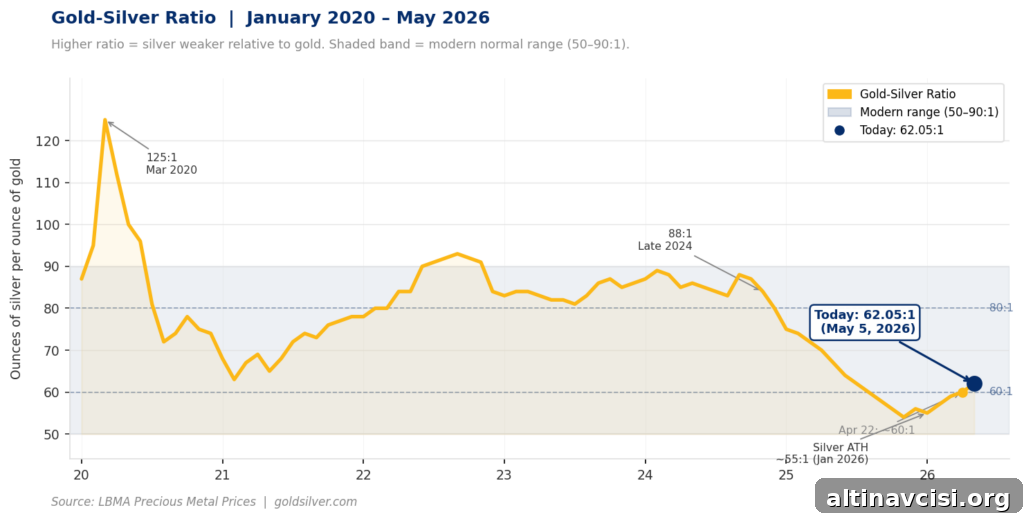
Since then, silver has retraced more sharply than gold. The ratio has expanded back to 62.05:1 as of May 5, 2026. That shift reflects short-term market positioning, not a fundamental reversal of silver’s multi-year story.
What Is the Gold-Silver Ratio and What Does It Mean Today?
The gold-silver ratio shows how many ounces of silver are required to buy one ounce of gold. At 62.05, one ounce of gold equals about 62 ounces of silver. A rising ratio means silver is weaker relative to gold; a falling ratio means silver is stronger.
Historically, under bimetallic standards the ratio was fixed near 15:1 (the U.S. Coinage Act of 1792 set that level). Geological abundance is somewhat close to that legal benchmark — the U.S. Geological Survey estimates about 17.5 times more silver than gold in the earth’s crust — but governments removed that price anchor when silver lost its formal monetary role in the late 19th century.
Since 2000 the ratio has moved widely, most commonly between 50:1 and 90:1. Sharp market stress produces spikes: it reached 88:1 in late 2024 before silver’s historic rally and briefly hit 125:1 in March 2020 during the COVID liquidity panic — a moment when risk assets were sold aggressively while gold held value.
Although the modern ratio is far from the old 15:1 anchor, these contemporary extremes still help indicate when silver is historically cheap relative to gold.
Today’s 62:1 sits in the lower-middle of the modern range: not an extreme, but not historically cheap either. More important than the level is the recent direction: the ratio has widened meaningfully in just a couple of weeks, which reflects positioning shifts rather than a structural breakdown.

The Edge Every Investor Needs
Smarter precious metals investing starts here. The Nuggets Newsletter delivers timely market insights, Fed updates, global trends, and educational content.
Subscribe for market alerts and analysis (form removed for privacy and performance).
Why Is Silver Underperforming Gold Right Now?
Silver has two distinct demand drivers. First, a monetary role: it has functioned as money for millennia, preserving purchasing power and moving with gold when real yields and the dollar change. Second, an industrial role: roughly 60% of silver demand is industrial, coming from solar panels, electric vehicles, 5G infrastructure, and semiconductors. When economic activity looks strong, silver often outperforms gold; when growth concerns return, silver tends to lag.
Since April 22 the market has begun to price in a possible de-escalation of the Iran conflict — not a definitive peace, but lower acute risk. As geopolitical risk declines, the safe-haven premium in both metals fades. Because silver carries an industrial premium, markets sold silver harder: easing energy or supply disruption fears reduce near-term industrial demand expectations and prompted heavier selling.
The data supports this view. Silver reached an all-time high of $121.62/oz on January 29, 2026, driven by a convergence of monetary and industrial demand. It has since dropped roughly 39%. Gold has held up substantially better, and the ratio has shifted back toward the middle of its modern range.
Has the Structural Case for Silver Changed?
No. The recent ratio expansion appears cyclical and tied to short-term positioning. The structural case for silver remains strong, if anything strengthening.
According to the Silver Institute’s World Silver Survey 2026 (published April 15), the market is set for its sixth consecutive annual supply deficit in 2026. Since 2021, the world has drawn down roughly 762 million ounces from above-ground inventories to satisfy demand that current production cannot meet.
China’s silver imports hit a record in March 2026, driven by retail buyers treating silver as a lower-cost store of value compared with gold and by solar producers accelerating purchases ahead of tax changes. That month marked the highest monthly import volume on record.
Basel III regulatory changes are also reducing banks’ paper exposure to precious metals, a structural shift that removes some leverage that has weighed on spot prices historically. Banks have been reducing paper precious metals positions in anticipation of these rules.
None of these structural facts changed during the recent two-week fluctuation.
What Does the Gold-Silver Ratio at 62:1 Mean for Investors?
At current prices (~$4,578 gold / ~$73.78 silver), the 62:1 ratio implies three practical considerations for investors.
First, silver is still well below its peak relative to gold. When the ratio approached 50:1 briefly in early 2026, silver traded nearer $90–95. If the ratio compresses back to that region with gold above $4,500, silver would trade materially higher than current levels. At 62:1, silver is not overvalued, nor is it at a historical low.
Second, the divergence between supply fundamentals and the price is widening. When positioning drifts from fundamentals, re-convergence can be abrupt. This behavior is common in commodity markets where sentiment and inventory realities diverge.
Third, a frozen Fed is a meaningful tailwind for silver. The Federal Reserve faces constraints: it cannot tighten into a weakening labor market, nor can it cut when ISM Prices Paid sits at 84.6 — a high level. A Fed that remains on hold keeps real yields suppressed, lowering the opportunity cost of holding non-yielding stores like gold and silver. If monetary pressure eases further, silver at 62:1 has more potential upside relative to gold.
The Second Corner: What the Ratio Is Really Telling You
The obvious read of the current ratio is simple: silver underperformed gold recently and the ratio widened — a bearish short-term signal tied to positioning. That is the first corner: what happened.
The second corner is more nuanced: silver underperforming gold in a short-term adjustment does not mean silver’s structural case is weakening. It reflects the two distinct demand drivers temporarily moving in opposite directions.
- The monetary case — multi-year deficits, Basel III capital shifts, and the sound-money thesis — remains intact.
- The industrial case — exposed to near-term demand uncertainty and ceasefire pricing dynamics — experienced a temporary setback.
For investors holding physical silver as part of a sound-money allocation, 62:1 is not a warning. It is a snapshot showing how markets price a dual-purpose metal when one of its demand drivers is briefly out of favor.
The six-year supply deficit is unaffected by diplomatic timelines. Solar demand and China’s record import volumes are structural trends that do not reverse with a short ceasefire. And the Federal Reserve’s difficulty normalizing policy — the core long-term driver for precious metals — won’t be overturned by a two-week ratio move.
The gold-silver ratio in 2026 is communicating multiple signals. Make sure you focus on the structural message, not just the short-term noise.
Stay On Top of Gold & Silver Prices
Get important market alerts sent straight to your inbox.
Sign up to receive timely gold and silver market alerts.
SOURCES
1. GoldSilver.com — Live Gold & Silver Price Charts
2. GovInfo.gov — U.S. Coinage Act of 1792
3. U.S. Geological Survey — Silver Statistics and Information
4. London Bullion Market Association — Precious Metal Prices & Historical Data
5. The Silver Institute — World Silver Survey 2026
6. General Administration of Customs, People’s Republic of China — Trade Statistics
7. Institute for Supply Management — ISM Report on Business
8. Bank for International Settlements — Basel III Framework
Disclaimer: This article is for informational purposes only and does not constitute financial or investment advice. Always consult a qualified financial adviser before making investment decisions.
You May Also Like:
- Gold, Silver, and Stagflation: 5 Signals That Matter Now
- Why Gold Fell on the Hormuz Tanker Strike
- WGC Q1 2026: What Asia Knows That Wall Street Doesn’t
- BEA Stripped Silver From GDP. Here’s What It Means
- PCE at 3.5%, GDP Miss: Why This Is Bullish for Gold
- How Warsh’s Inflation Measure Could Move the Gold Price
- Gold Is Down 19%. This $3.8B Bet Says It Doesn’t Matter
- Gold, Oil, and the Fed: Why the Old Rules Don’t Apply
Popular Topics
Picked from the archive
-
01
 Topics
Federal Reserve Pauses While Debt Soars: Gold Outlook
-
02
Topics
Treasury Secretary Urges Fed Rate Cut After Revised Jobs Report
-
03
Topics
Why Metals Led Markets in 2025 and What It Means for 2026
-
04
Topics
Numismatic vs Bullion Coins: Which Should You Buy?
-
05
Topics
How the Current Gold Rally Compares to Past Bull Markets
-
06
Topics
World Gold Council: Gold Nears Technical Break as Markets Stall
-
07
Topics
Central Bank Gold Sales and Their Impact on Prices
-
08
Topics
Gold at $3,400 as Markets Await Aug 28, 2025 PCE Data