Gold vs Bitcoin: Which Is the Smarter Investment Today?
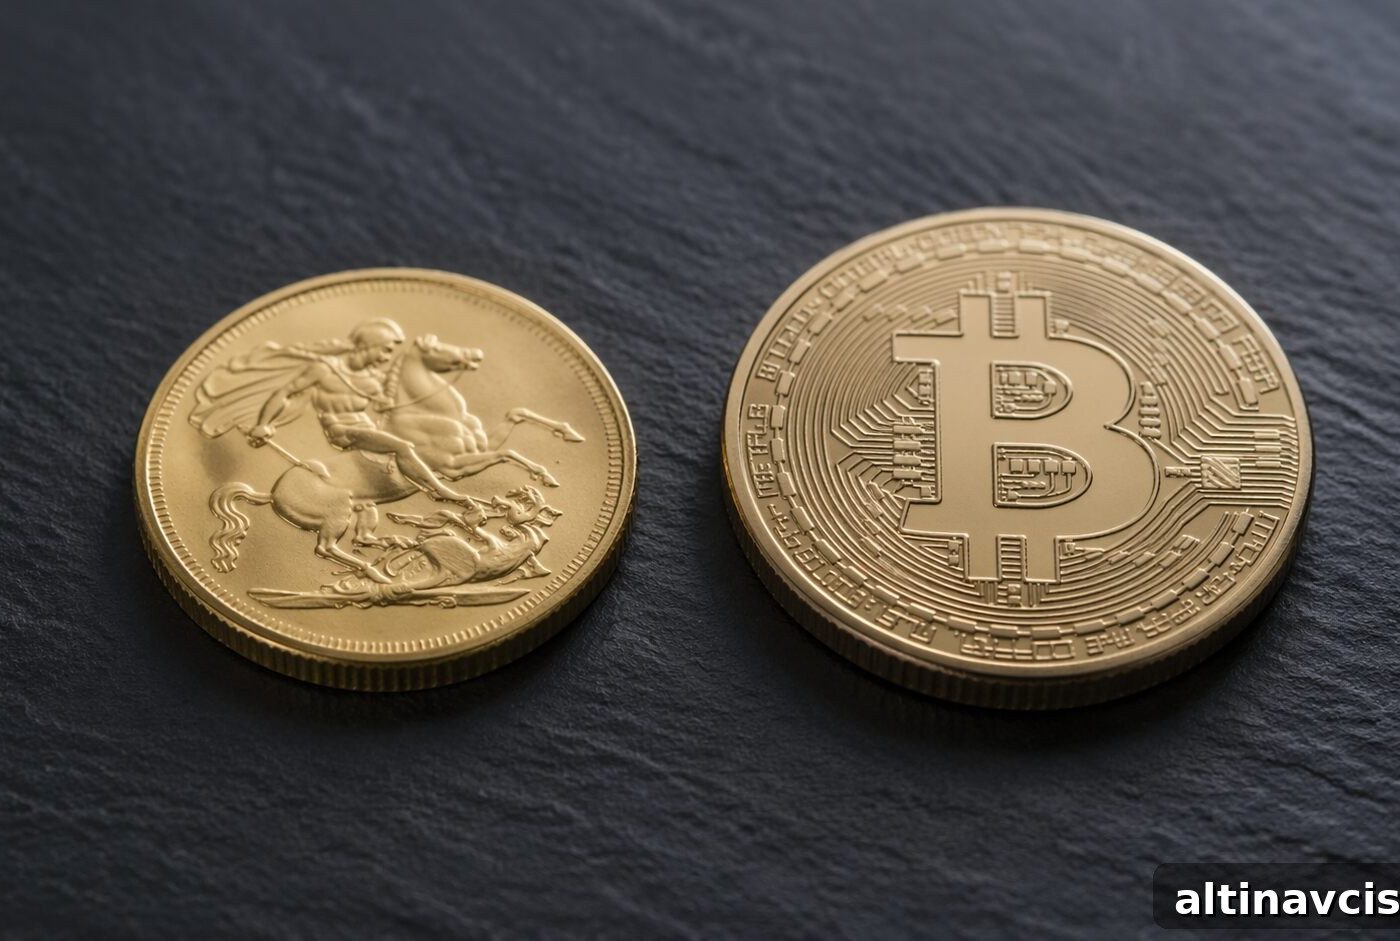
In the gold vs. bitcoin debate for 2026, the headline numbers reveal much of the story.
Gold has retreated roughly 14% from its January 2026 all-time high of $5,589 per ounce. Bitcoin has fallen more than 41% from its October 2025 record of $126,198. Both assets have pulled back, but those moves reflect very different market dynamics.
Gold Dropped. Bitcoin Dropped Harder. Here’s the Data.
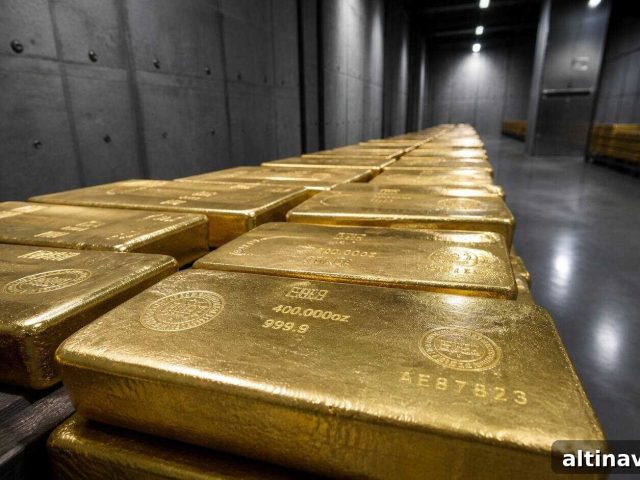
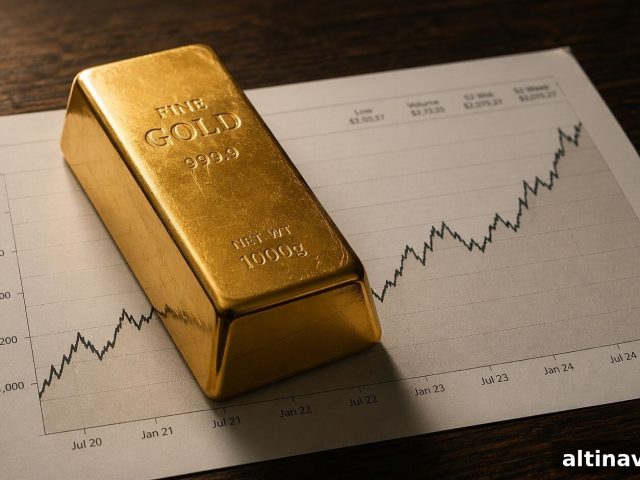
Gold reached an all-time high of $5,589 on January 28, 2026, amid rising US–Iran tensions and a Federal Reserve decision to hold rates. After a brief easing of those tensions, the price has consolidated and currently trades near $4,810 — about 14% below the peak. That pullback looks like a consolidation inside an ongoing bull market rather than a structural reversal.
Bitcoin’s path differs. After peaking at $126,198 on October 6, 2025, Bitcoin traded near $74,300 by mid-April 2026, a decline of over 41%. Bitcoin began 2026 around $87,500 and has lost roughly 23% year-to-date through mid-April, marking its first consecutive quarterly losses since 2022. Over that same period, gold was up approximately 11% year-to-date. The contrast is stark: a 14% retreat for gold versus a 41% collapse for Bitcoin.
How Far Has Gold Actually Fallen?
By historical standards, not far. Gold’s roughly 14% pullback from $5,589 has left the metal trading in a band around $4,780–$4,810. That decline coincided with a two-week ceasefire between the US and Iran that briefly reduced safe-haven demand and pushed oil prices below $100. When tensions re-escalated, gold regained ground and moved back toward $4,800.
Gold returned about 67% in 2025 and set dozens of new highs that year. A 14% correction after such a large gain is consistent with prior consolidations that eventually resolved to higher prices. Investors who held through 2025 still sit on substantial gains compared with most other asset classes.
Is Bitcoin’s Drop Just a Deeper Version of Gold’s?
No. That distinction matters. Bitcoin’s fall of more than 41% from its October high constitutes a bear-market level decline under conventional definitions, while gold’s 14% pullback looks like a correction within a larger uptrend.
Bitcoin has endured much larger drawdowns historically — declines exceeding 70% in both 2018 and 2022 — and its realized annualized volatility has been substantially higher than gold’s. As of early 2025, Bitcoin’s annualized realized volatility was about 52%, more than three times gold’s annualized volatility of below 15%. Those differences aren’t academic: they determine how assets behave during stress and how tolerable large losses are for investors.
Over multi-year cycles Bitcoin has delivered outsized absolute returns, but that performance comes with greater psychological and financial volatility. In early 2025, when geopolitical stress peaked, gold pushed to new highs while Bitcoin moved lower — a divergence that reflects the distinct roles these assets play.
Why Does Gold Hold Its Value When Markets Break Down?
Gold’s role as a safe-haven asset is structural rather than purely traditional. During several major market drawdowns between 2018 and 2025, gold averaged gains when equities fell sharply, while Bitcoin typically lost value in the same episodes. Institutions, central banks, and sovereign wealth funds often increase gold exposure when they need to reduce risk.
Liquidity differences reinforce this behavior. A very large sale of Bitcoin can move prices considerably because market depth is limited compared with the global gold market, where similar-sized transactions register with far less price impact. At scale, that liquidity asymmetry separates a functional safe-haven asset from a more illiquid, volatility-prone instrument.
Does Gold’s Track Record Support Buying the Dip?
History suggests that corrections inside established gold bull markets often resolve higher. Gold closed 2025 at about $4,368 and surged to $5,589 by late January 2026. The structural forces behind that rally — dollar weakness, compressed real yields, institutional safe-haven demand, and record central bank buying — have not reversed. Given that backdrop, many investors view a mid-cycle pullback as an opportunity to add exposure.
Over the longer term, from 2000 to 2025, gold produced average annual returns near double digits and compounded strongly. Every major pullback in that period was eventually followed by fresh highs, whether after financial crises, rate cycles, or geopolitical shocks.
What Are the Biggest Institutions Saying About Gold Right Now?
Major institutions have been net buyers. Central banks added substantial amounts of gold in 2025, and exchange-traded funds recorded strong inflows that year, pushing physical holdings to record levels. Several large banks and asset managers updated their forecasts higher in early 2026, citing ongoing central bank demand, investor interest, and macro factors that continue to support prices.
These forecasts vary in precision, but the common theme is that institutional demand and structural drivers remain supportive. In other words, the dominant market participants that monitor gold closely are not liquidating positions en masse; many are increasing exposure.
Is This a Good Entry Point for Gold?
A 14% correction within a confirmed bull market often presents a reasonable opportunity to add exposure, especially when the structural case remains intact and the emotional pressure to buy at highs has eased. Gold is still significantly higher than it was 18 months earlier, and the macro drivers that propelled that move — reserve diversification, persistent inflation pressures, geopolitical risk premium, and ETF inflows — continue to be relevant.
Rather than focusing solely on how far gold is off its January peak, it can be more useful to compare gold with alternative assets. Bitcoin’s larger drawdown, persistent equity underperformance over the previous 12 months, and negative real yields on cash after inflation reinforce the argument that gold can serve a distinct portfolio role.
Bottom Line
Gold’s 14% correction from the January 2026 high looks like a pause inside a structural bull market, not a reversal of its fundamental case. Bitcoin’s 41% decline from its 2025 record is a reminder that greater upside potential typically accompanies much higher volatility and drawdown risk. Institutional flows and forecasts remain broadly supportive of gold, and many large holders continue to add exposure rather than sell into the pullback.
If you were waiting for a better entry than January’s peak, current data suggests this pullback may offer an opportunity to reassess exposure to gold relative to other assets. As always, consider your objectives, risk tolerance, and time horizon before making investment decisions.
People Also Ask
Is gold a better investment than Bitcoin right now?
Based on the data presented for early 2026, gold has outperformed Bitcoin year-to-date and has shown greater resilience during geopolitical stress since their correlation diverged in early 2025. Which is “better” depends on an investor’s risk tolerance, time horizon, and allocation goals.
Why is gold down if it’s supposed to be a safe-haven asset?
Gold’s pullback followed a temporary easing of geopolitical tensions and lower oil prices during a brief ceasefire. When the situation shifted again, gold began to recover. Corrections of this scale are common in bull markets and do not necessarily change the underlying safe-haven case.
How does gold’s volatility compare to Bitcoin’s?
Gold’s annualized volatility is generally below 15%, while Bitcoin’s realized annualized volatility has been substantially higher—about 52% as reported in early 2025—making Bitcoin considerably more volatile and prone to large drawdowns.
Are central banks buying gold or Bitcoin?
Central banks have been active buyers of gold, adding significant tonnes in 2025. No major central bank has publicly reported significant Bitcoin holdings as a formal reserve asset.
SOURCES
Reuters, Trading Economics, World Gold Council, Morningstar, CoinMetrics, State Street Global Advisors, Bloomberg, JP Morgan Global Research.
Disclaimer: This article is for informational and educational purposes only and does not constitute investment advice. Past performance is not a guarantee of future results. Consult a qualified financial advisor before making any investment decision.
You May Also Like:
- What the Silver-to-CPI Ratio Reveals That Spot Price Hides
- Dow to Gold Ratio: 100 Years of History Decoded
- Gold Dip Buying Explained: Is This A Smart Move Now?
- Gold Coins vs. Gold Bars — Which is Better for Investors

Your Gold Buying GuideMost investors overpay when they buy gold and again when they sell. This guide explains what to own and why.
Popular Topics
Picked from the archive
-
01
 Topics
Gold, Silver Prices Hold Steady Ahead of Jackson Hole Summit
-
02
Topics
Gold Price to Hit $5,500 by Q1 2027? Central Bank Risk
-
03
Topics
Gold and Silver Rally After Venezuelan Shock Roils Markets
-
04
Topics
Inflation Under Trump: Fact Check on Price Changes
-
05
Topics
Key Indicator to Watch for Gold Ahead of Fed Decision
-
06
Topics
Trump Tours $2.5B Fed Renovation, Presses Powell on Rates
-
07
Topics
How the London Gold Fixing Shapes Global Gold Prices
-
08
Topics
Is Gold Overpriced or Undervalued? What 3 Models Reveal