Last verified August 2026.
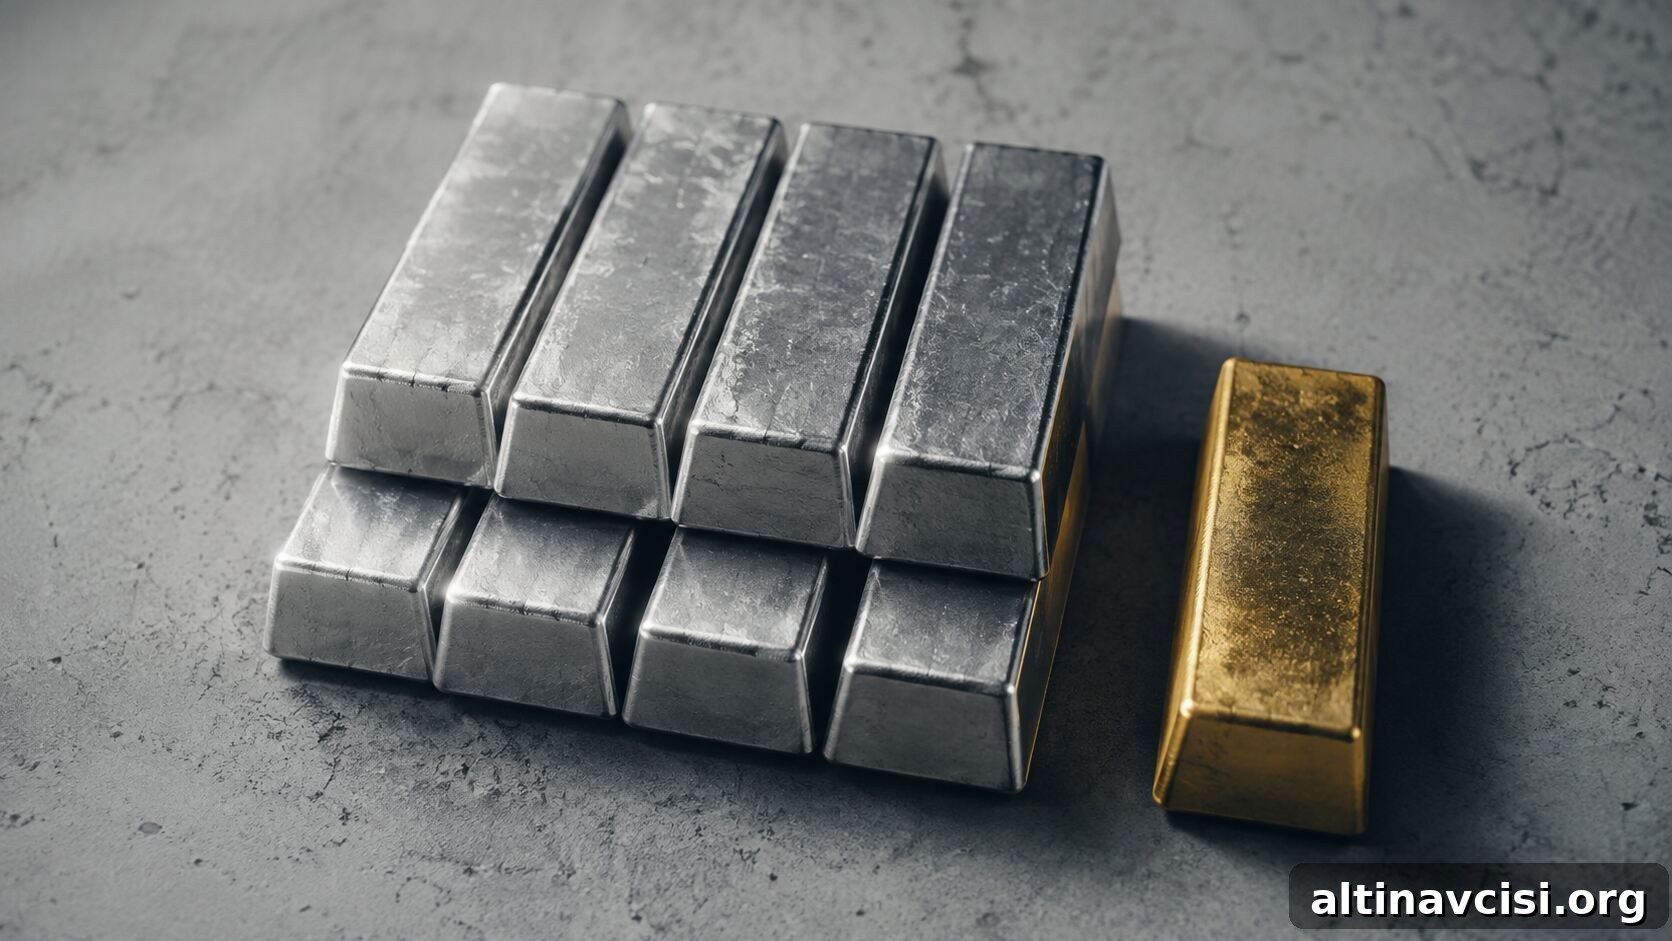
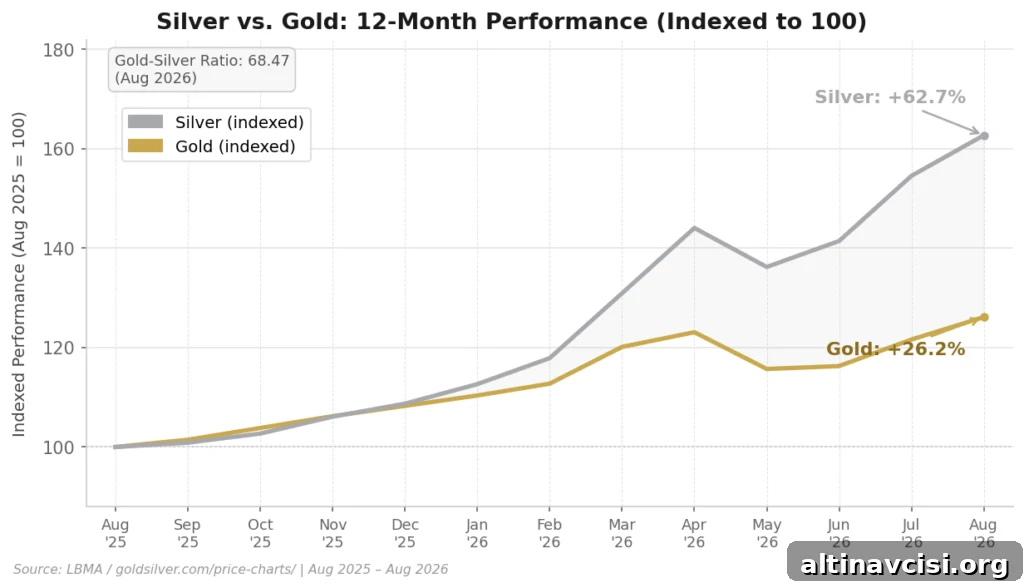
Silver is currently outpacing gold because a multi-year structural supply deficit has begun to collide with strong industrial demand. Ten years ago, much of that industrial demand barely existed. The market is only now pricing in the effects of that collision. Over the past year silver has risen roughly 62.74% based on LBMA pricing, more than double gold’s gain of about 26.15%, even though gold tends to attract more headlines.
As of August 5, 2026, silver trades near $62.12 and gold near $4,253 using LBMA figures. That divergence has driven the gold-silver ratio down to about 68.47, reflecting how many ounces of silver are needed to buy a single ounce of gold.
What’s Actually Driving Silver’s Supply Shortage?
The Silver Institute’s 2026 World Silver Survey, prepared by Metals Focus, reports a global silver deficit of about 46.3 million ounces for the year. This marks the sixth consecutive annual shortfall. Since 2021 the cumulative deficit totals roughly 762 million ounces. A key reason for this persistent gap is that most silver is produced as a byproduct of base-metal mining—primarily lead, zinc and copper—rather than from dedicated silver mines. That means higher silver prices alone do not quickly create meaningful new primary silver production the way prices can spur more output for commodities where mining decisions are driven directly by that commodity’s value. In short, you can’t simply “drill your way out” of a multi-year shortage when the decision to expand production rests with copper or zinc miners, not with silver-specific operators.

The Edge Every Investor Needs
Smarter precious metals investing starts here. The Nuggets Newsletter brings essential market insights, Fed updates, global trends, educational videos, and more.
What’s Pulling Industrial Demand Higher?
Industrial consumption of silver reached about 657.4 million ounces in 2025, roughly 58% of total global demand, according to the Silver Institute. A decade ago many of the demand centers now driving consumption were insignificant. Electric vehicle manufacturers use silver in battery contacts and charging stations. AI data centers require silver in cooling systems and circuit boards. Solar panel manufacturing continues to be a steady and substantial source of demand. These industrial sectors rely on silver because few, if any, alternative materials match its electrical conductivity and reliability at scale.
Physical trade flows underline this shift. China recorded a quarterly import record in early 2026 of roughly 1,626 tonnes, reversing a long-standing pattern of being an exporter of refined silver. At the same time, India’s shipments contracted after its silver import duty rose from 6% to 15%, reducing demand at the margin. Those movements illustrate how consumption patterns and policy choices can rapidly reshape global physical balances.
Why Does the Gold-Silver Ratio Matter Right Now?
The gold-silver ratio expresses how many ounces of silver are equivalent to one ounce of gold. At roughly 68.47 in August 2026, the ratio has been compressing because silver benefits from two demand drivers at once: monetary interest from investors and growing industrial consumption. Gold, by contrast, is driven primarily by monetary and investment demand. When both silver’s industrial and monetary engines run together, silver’s price strength narrows the ratio versus gold.
What Do Wall Street’s Silver Forecasts Say?
Major financial institutions offer a range of year-end silver targets, reflecting differing views on how structural the demand shift is. Some of the notable targets reported in 2026 include high-end projections in the $85–$100 range from certain research teams, mid-range forecasts near $70–$86 from other banks, and more conservative estimates around $60–$67. Even the more cautious forecasts generally assume silver retains most of this year’s gains; the variance comes down to how persistent analysts expect the supply deficit and industrial appetite to be.
Why Does This Matter Beyond the Price Chart?
This story is not primarily about central bank announcements or geopolitical headlines. Real yields were historically elevated in 2026, which breaks the classic scenario where falling real rates drive precious-metals rallies. Instead, the current move reflects a physical market dynamic: sustained consumption that has outpaced mining output for multiple years. For savers and investors that distinction matters. A rally driven by monetary policy can reverse quickly if policy shifts. A physical shortage that industry cannot easily substitute, however, must ultimately be resolved through the metal’s own supply and demand balance—either higher prices, increased recycling, or, over time, more primary production targeted at silver if viable.
What Questions Come Up Most About Silver’s Rally?
Why is silver outperforming gold in 2026?
A sixth consecutive annual supply deficit of about 46.3 million ounces is meeting industrial demand that accounts for roughly 58% of total use, compressing the gold-silver ratio to the high‑60s.
How does silver’s yearly gain compare with gold’s?
Silver rose roughly 62.74% over the past year versus gold’s approximate 26.15% gain, putting silver near $62.12 and gold near $4,253 as of early August 2026.
How is the gold-silver ratio calculated?
Divide the gold price by the silver price. For example, $4,253 divided by $62.12 equals about 68.47—about 68 ounces of silver per ounce of gold.
Are falling interest rates driving silver’s rally?
No. Real yields were elevated in 2026, not falling, so the rally appears driven by physical scarcity and rising industrial demand rather than a conventional rate-driven precious metals trade.
What’s driving silver’s industrial demand higher?
New and expanding consumers include electric vehicle manufacturers, AI data center hardware, and solar panel producers—sectors that barely mattered a decade ago—along with long-standing electronics demand.
What happens if the silver supply deficit continues?
If deficits persist beyond the six recorded years (totaling roughly 762 million ounces since 2021), above-ground stocks that bridge mine supply and demand will continue to shrink, placing further upward pressure on prices unless supply or substitution changes materially.
SOURCES
1. LBMA — Silver & Gold Daily Prices, August 5, 2026.
2. Silver Institute — World Silver Survey 2026, May 2026.
3. Metals Focus — World Silver Survey 2026, May 2026.
4. Selected bank and institutional commodities research reports, H1–H2 2026.
Disclaimer: This article is for informational purposes only and does not constitute investment advice. Past performance is not indicative of future results. Consult a qualified financial advisor before making investment decisions.
You May Also Like:
- Hormuz. ISM. Hecla. Barrick. Five Things That Moved Gold and Silver Today.
- Jobs Missed. Gold Hit $4,200. Silver Hit $62.
- South Korea’s Central Bank Resumes Gold Purchases After 13 Years.
- Gold and Silver Hold as Regional Tensions and Economic Data Shift Sentiment.
- Why Gold Is Holding Near $4,067 Ahead of a Jobs Week That Could Affect Rates.
- Manufacturing Strength Didn’t Move Gold—Here’s Why That Matters.
- Gold Is Caught Between Structural Bull Forces and Policy Risks.