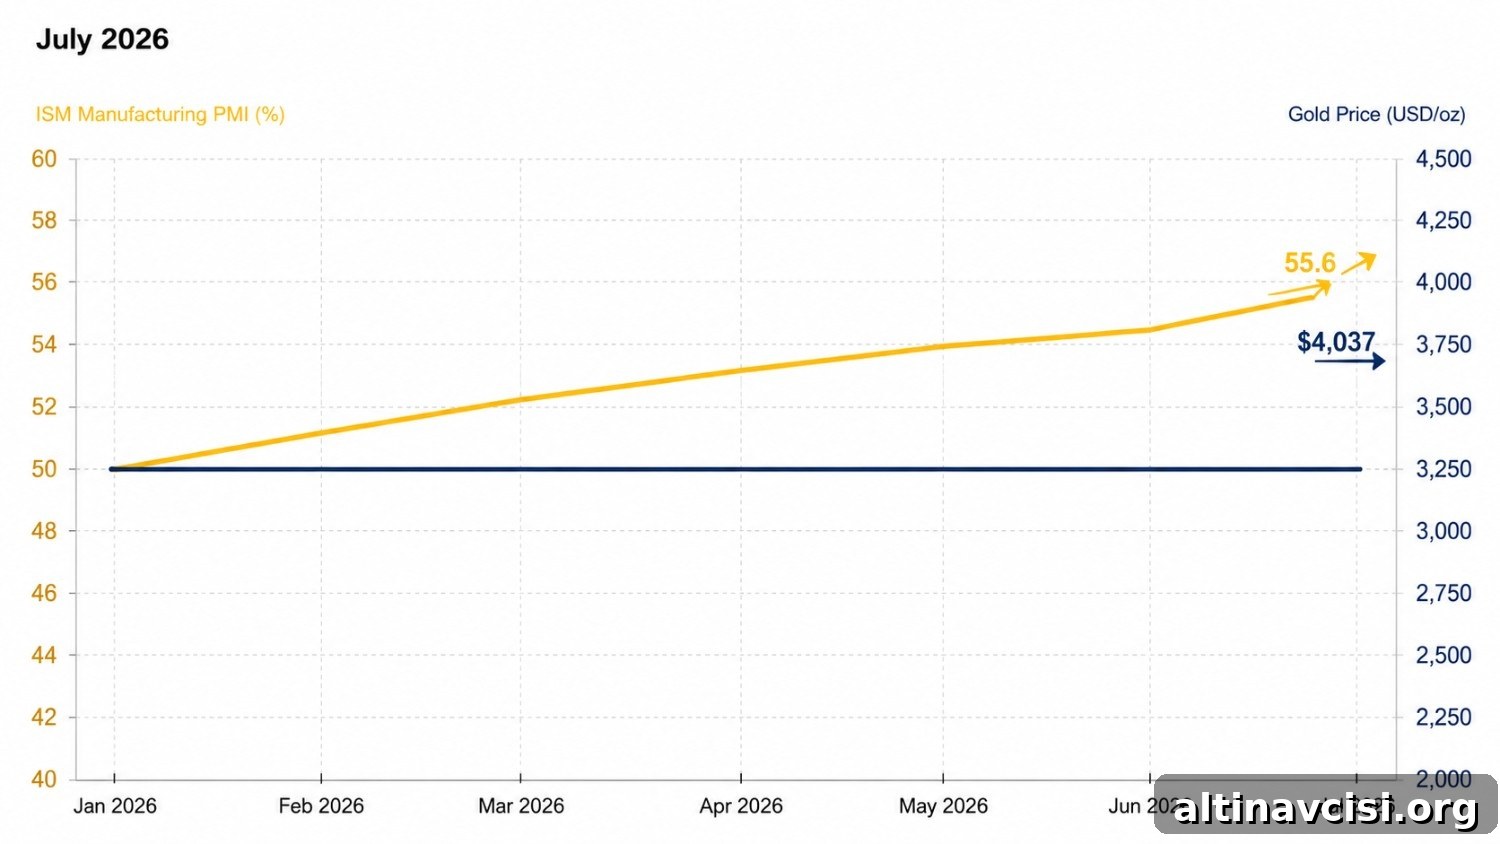
Gold trades near $4,037 per ounce after the strongest U.S. manufacturing report in more than four years. The muted reaction is not a failure of gold to respond; it is a signal. Gold is reflecting two nearly offsetting market forces — one pushing prices down and the other supporting them — leaving the metal in a standstill until new information arrives.
The ISM Manufacturing Purchasing Managers’ Index rose to 55.6% in July 2026, according to the Institute for Supply Management’s report released this morning. That result exceeded the consensus estimate of 54.0% and climbed 2.3 points from June’s 53.3%. It is the highest reading since May 2022. Under normal conditions, a reading this strong would typically weigh heavily on gold. Today, however, gold barely moved — and that quiet response reveals what investors should focus on for the rest of the week.
Why Did Gold Barely Move After the Strongest Manufacturing Report in Four Years?
In short: the ISM report delivered two opposing signals at once, and gold absorbed both.
The first signal is explicitly hawkish. A 55.6 PMI indicates faster economic expansion. That outcome strengthens the case that the Federal Reserve can tolerate tighter monetary policy, boosting the probability of a September rate increase. Higher expected policy rates tend to compress gold’s upside because non-yielding assets lose relative appeal when the opportunity cost of holding them rises.
The second signal points the other way. The ISM Prices Paid sub-index registered 71.1%, slightly below June’s 73.0% but still above the forecast of 70.3%. Respondent comments highlighted pricing volatility: 57% of negative sentiment cited price swings. In short, manufacturers remain under sustained cost pressure, and that persistent inflationary backdrop preserves the case for gold as an inflation hedge.
Those two forces — a growth-driven hawkish impulse and an inflation-driven bullish impulse — are pulling in opposite directions. The result is a temporary equilibrium for gold that requires fresh data to break. That new information will arrive across several releases this week.
The Edge Every Investor Needs
Smarter precious metals investing starts here. The Nuggets Newsletter delivers market insights, Fed updates, global trends, and educational content to help you make better-informed decisions.
What Does the ISM Employment Index Returning to Expansion Mean for the Fed?
One of the most consequential but easily overlooked parts of the report is the Employment sub-index. It rose to 52.8% from June’s 49.7%, moving back into expansion for the first time in 33 months, as noted by ISM Chair Susan Spence.
This is meaningful. Manufacturing employment had been contracting or flat for much of the past three years, providing Fed officials with evidence of labor-market softness in that sector. Today’s shift removes that reassurance and strengthens the argument for policymakers who favor tighter policy. Several regional Fed presidents previously expressed support for further rate increases, and a broadening labor picture in manufacturing gives the hawkish camp additional cover.
The ISM Production sub-index also jumped sharply to 58.5% from June’s 52.2%, indicating manufacturers are boosting output, not just taking new orders. For gold, that dynamic makes the September Federal Open Market Committee meeting more consequential. Strong manufacturing metrics alone won’t necessarily move gold dramatically, but they increase the odds of tighter policy — an outcome that typically pressures gold prices.
What Should Gold Investors Watch This Week?
This week’s economic schedule reads like a live tally of whether the Fed will tighten in September. Each release will either strengthen or weaken the rate-hike case.
Tuesday brings the JOLTS report on June job openings. A soft JOLTS print would ease rate-hike odds and could give gold a modest boost. Conversely, a strong reading would add to the hawkish momentum the ISM report already created.
Wednesday features the ADP employment report and the ISM Services PMI. Together these reports offer insight into private-sector hiring and whether services-sector inflation — which has been running above manufacturing inflation for much of 2026 — is beginning to cool.
Friday’s nonfarm payrolls report is likely to be decisive. Before the July 29 FOMC meeting, market-implied hike probabilities had varied significantly; recent data and Fed commentary have pushed those odds around. A robust payrolls number would increase the likelihood of a September hike and add pressure on gold. A weak payrolls print would reverse that narrative and re-open upside for gold, potentially lifting it toward and above $4,100.
An additional structural support for the gold market is ongoing central bank demand. The World Gold Council reported record second-quarter central bank purchases in 2026, and sovereign buying at lower prices suggests these purchases are driven by long-term strategic goals rather than short-term tactical decisions. That steady demand creates a floor for gold that can blunt rate-cycle headwinds.
Finally, the Prices Paid component at 71.1% matters for savers and investors because input-cost pressures typically filter into consumer prices with a three- to six-month lag. The July ISM inflation signal will feed into CPI and related inflation measures later this year. If above-target inflation persists, gold’s role as a long-term inflation hedge remains relevant for diversified portfolios.
Stay On Top of Gold & Silver Prices
Receive timely market alerts and insights delivered to your inbox.
SOURCES
1. Institute for Supply Management — July 2026 ISM Manufacturing PMI Report
2. Institute for Supply Management — June 2026 ISM Manufacturing PMI Report
3. FXStreet — ISM Manufacturing PMI coverage
4. CME Group — FedWatch Tool
5. World Gold Council — Gold Demand Trends Q2 2026
6. Federal Reserve — FOMC Statement, July 29, 2026
7. GoldSilver — Spot Price Charts, August 3, 2026
Disclaimer: This article is informational only and does not constitute financial or investment advice. Consult a qualified financial advisor before making investment decisions.
You May Also Like:
- Gold Is Caught Between a Structural Bull Case and a Policy Ceiling. Something Has to Give by Thursday.
- The Same Force That Crushed Gold All Year Just Flipped
- Gold ETFs Lost 45 Tonnes Last Quarter. Central Banks Bought 289. Here’s What That Split Means.
- Gold Had Every Reason to Rally Today. It Didn’t. Five Reasons Why.
- Central Banks Bought 289 Tonnes of Gold Last Quarter. Prices Were Falling the Whole Time.
- Warsh Said the PCE Drop Was “Not Much” of a Consideration. Gold Agreed.