Gold opened the session near $3,983, then spiked after the Bureau of Labor Statistics released the June Consumer Price Index. At 8:30 a.m., the CPI showed a 0.4% drop for the month — the sharpest monthly decline since April 2020 — and gold surged to around $4,103. By 10:00 a.m., as Federal Reserve Chair Kevin Warsh began testimony before the House Financial Services Committee, the metal was trading more than $90 higher on the day.
Many reports stopped at that headline move. The full story, however, runs deeper and points to both short-term drivers and a potentially meaningful shift in how the Fed evaluates inflation risks.
Why Did Gold Rally on the June CPI Report?
The mechanics were clear. June’s headline annual inflation rate fell to 3.5%, down from May’s 4.2% and below the 3.8% consensus. More important for markets, core CPI — which excludes food and energy — registered a 0.0% monthly change. Central bankers focus heavily on core inflation; a flat print relieves some upward pressure on interest-rate expectations.
When core inflation shows no monthly gain, the perceived need for additional rate hikes softens. That reduces the expected path of real (inflation-adjusted) yields. Gold pays no interest, so lower real yields make holding gold relatively more attractive. Futures and options markets adjusted quickly: traders cut the odds of a September rate increase and the probability that the Fed will hold rates steady in July rose sharply. The two-year Treasury yield, which moves with Fed expectations, fell and gold tracked that decline upward.
It’s important to note, though, that June’s weakness came largely from energy. Gasoline prices plunged nearly 9.7% month-over-month, and the broader energy index declined about 5.7%. That drop followed a brief de-escalation in tensions between the U.S. and Iran during June. Since then, geopolitical developments and renewed naval activity have pushed oil prices higher in July. Because energy can swing monthly CPI readings, the market recognizes June’s print may be temporary; that is partly why gold gave back some morning gains later in the day.
In short: the CPI data triggered an immediate market reaction, but the more durable signal came from what the Fed signaled in a separate policy document.
The Edge Every Investor Needs
Smarter precious metals investing starts with clear information. The Nuggets Newsletter offers timely market context, Fed updates, and practical perspectives.
What Did Warsh’s Monetary Policy Report Say About Money Supply?
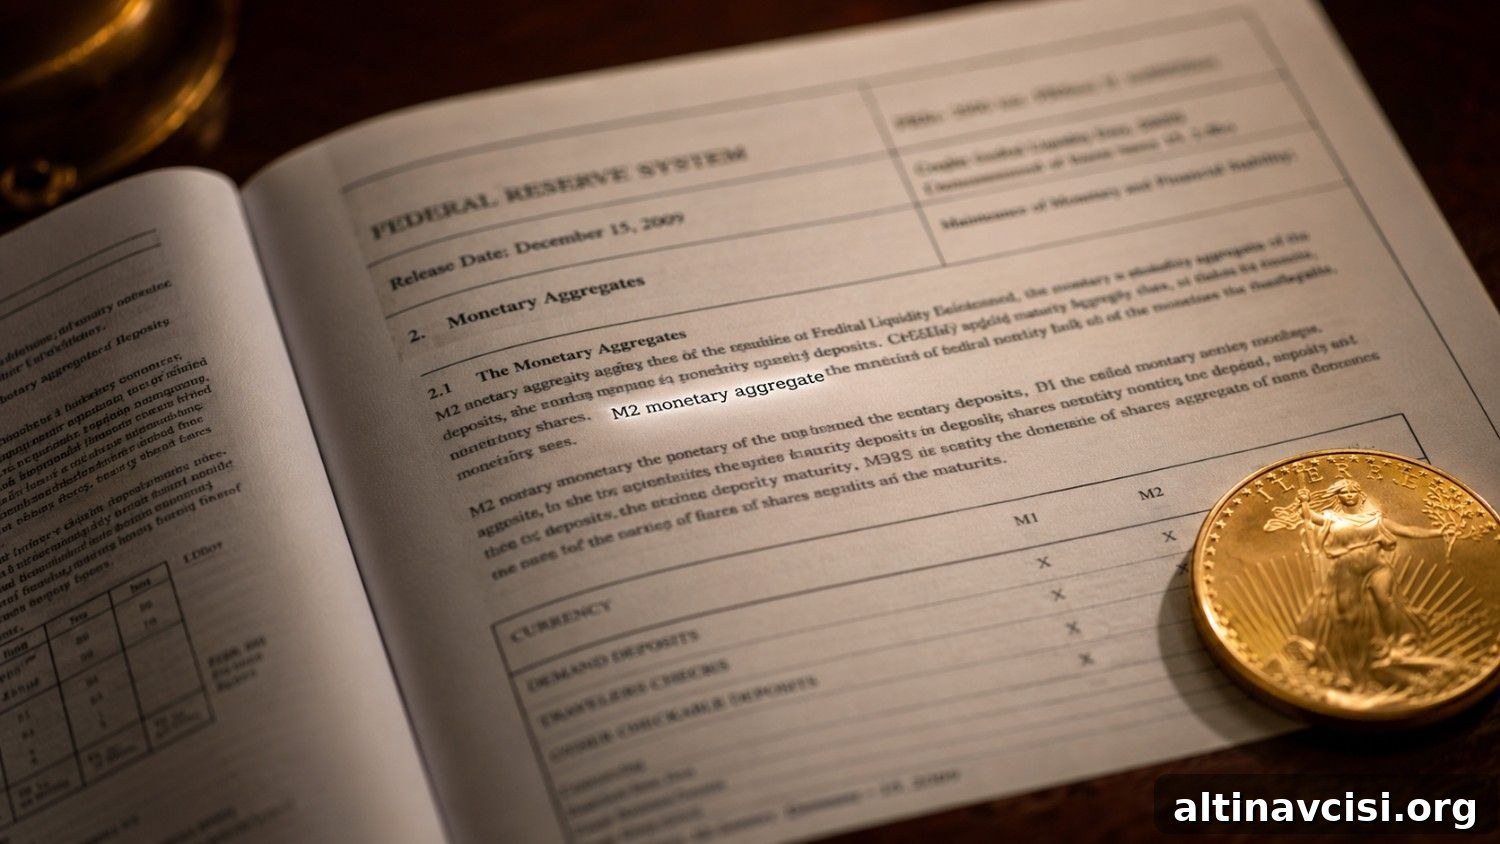
Chair Warsh appeared before Congress with the Fed’s July Monetary Policy Report in hand. Notably, the report’s abbreviations section restored M2 as a defined term — effectively placing the broad money supply measure back into the Fed’s published vocabulary. M2 includes currency, deposits, and retail money-market funds and represents the total money in circulation in the U.S. economy.
For much of the past decade, the Fed had sidelined M2, arguing it can be noisy and slow relative to more timely labor and price indicators. The institution increasingly leaned on high-frequency data instead. By formally acknowledging M2 again, Warsh signaled a philosophical shift: he has long described inflation as fundamentally monetary, meaning changes in the quantity of money matter for purchasing power.
That perspective aligns with a classic monetarist view and with why many precious-metals investors hold gold: as a safeguard against purchasing-power erosion that occurs when money supply expands faster than goods and services. Restoring M2 to official Fed documents is significant because it recognizes money growth as a non-trivial factor in inflation analysis.
What Else Did Warsh Signal in His Congressional Testimony?
Warsh did not offer explicit forward guidance on rate moves, a deliberate stance he has defended publicly. He reiterated the Fed’s independence and emphasized his commitment to following law and data, not politics. He also described the Fed’s 2020 flexible average inflation targeting framework as a policy mistake and announced five task forces to review Fed communications, the balance sheet, data quality, productivity models, and frameworks for analyzing inflation drivers.
The task force on inflation drivers deserves attention: if it concludes monetary aggregates like M2 should be reincorporated into the Fed’s policy framework, the central bank’s decision-making model could shift meaningfully from the one markets have grown accustomed to.
A Fed that formally considers money supply changes accepts a central idea long held by gold markets: the quantity of money is not a minor detail — it is a core part of the story about purchasing power and inflation.
What Happens Next for Gold and Silver?
By Tuesday afternoon, gold was trading near $4,062, roughly 1.5% higher on the day, and silver sat around $58.85, up nearly 2%. The gold-silver ratio hovered near 69, a level at which silver is historically cheap relative to gold; past recoveries have often featured ratio compression as both metals advance.
In the short term, the FOMC meets on July 28–29 and Warsh will testify before the Senate Banking Committee on July 15. The Producer Price Index is due the Wednesday before that testimony, offering another inflation data point. Beyond the immediate calendar, the longer-term picture looks anchored by a renewed structural case for gold: a Fed chair who emphasizes monetary variables, and a near-term inflation outlook that depends heavily on energy prices.
Today’s CPI gave gold a dramatic morning move, but whether those gains persist will depend on evolving data and how the Fed’s task forces reshape its analytical framework. Restoring money-supply measures to the Fed’s toolkit could sustain interest in gold as a hedge against monetary-driven inflation risks.
SOURCES
1. Bureau of Labor Statistics — Consumer Price Index Summary, June 2026 (USDL-26-1191, July 14, 2026)
2. Federal Reserve Board — Monetary Policy Report to Congress, July 2026 (July 10, 2026)
3. Federal Reserve Board — Testimony by Chairman Warsh, House Financial Services Committee (July 14, 2026)
4. Federal Reserve Board — FOMC Statement, June 17, 2026
5. Live gold and silver spot prices, July 14, 2026
6. CME Group — FedWatch Tool, Federal Funds Rate Probabilities, July 14, 2026
Disclaimer: This article is for informational purposes only and does not constitute financial or investment advice. Always consult a qualified financial adviser before making investment decisions.
You May Also Like:
- Gold Jumped $90 This Morning. June CPI Just Explained Why.
- Silver Fell 3.8% Today. Gold Fell 2.9%. The Gap Has a Name.
- Hormuz Toll Is an Inflation Tax. Here’s Why Gold Fell.
- Gold Fell 1.4% on an Iran Strike. One Number Tomorrow Morning Could Change Everything.
- Ceasefire Ends. Gold Barely Moved — Why that Matters.
- HSBC Cut Its Gold Forecast, Then Said Gold Could Rally Later This Year.