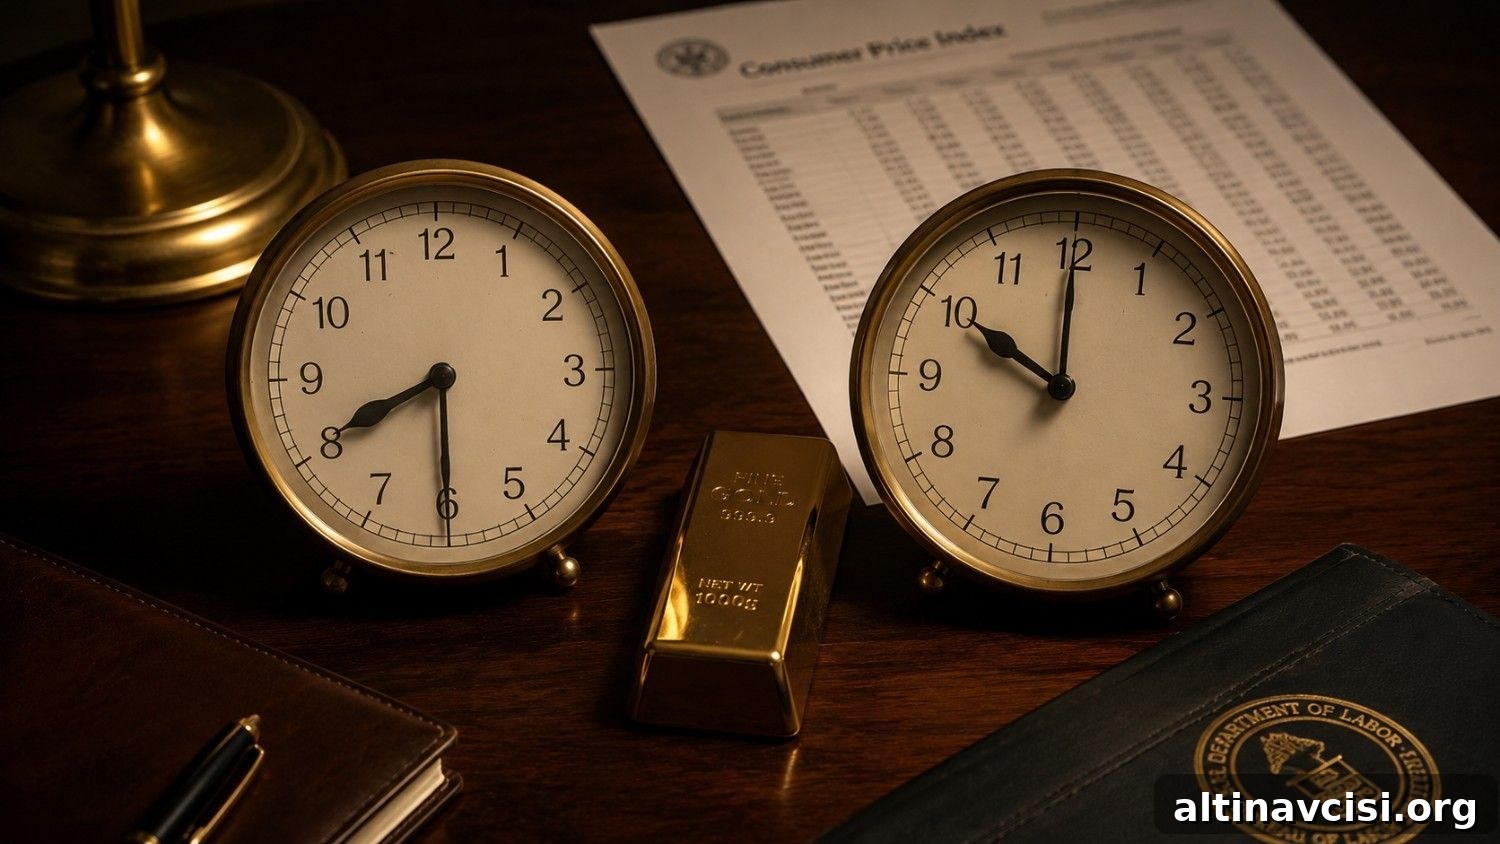
Gold is trading at $4,065 per ounce this morning, down $55 or about 1.4% on the day (price data through July 13, 2026). Silver has dropped to $58.49, off roughly 2.3%. Both metals slid after US forces launched a fourth round of strikes against Iran over the weekend in response to an Iranian attack on a Cyprus-flagged container ship. Tehran declared the Strait of Hormuz “closed until further notice,” a claim immediately dismissed by US Central Command.
At first glance, that looks like a straightforward geopolitical shock that should lift safe-haven assets such as gold. Instead, gold fell. The reason lies in bond market dynamics: rising real yields.
Why Does Gold Fall When Geopolitical Tension Rises?
The mechanism is familiar to readers following precious metals markets. When conflict threatens the Strait of Hormuz, oil prices typically rise because the waterway is a critical transit route for global crude shipments. Higher oil prices mean higher energy costs for consumers and businesses, which in turn push headline inflation upward. Rising inflation increases the odds that the Federal Reserve will keep interest rates higher for longer, or raise them further. That outlook lifts nominal yields and—importantly—real yields (nominal yields minus expected inflation).
Gold is a non-yielding asset. It pays no interest or dividends while held, so the opportunity cost of owning gold increases when real yields rise. Investors compare owning physical gold to holding Treasury bonds or cash instruments that provide a return. As real yields become more attractive, traders often shift from gold into yield-bearing assets, pressuring gold prices lower. That transmission—from geopolitical headline to oil to inflation expectations to real yields to gold selling—explains today’s decline.
In short: the Strait of Hormuz headline is the trigger; real yields are the lever that moves gold.
The Edge Every Investor Needs
Smarter precious metals investing starts here. The Nuggets Newsletter brings essential market insights, Fed updates, global trends, educational videos, and more.
What Does June CPI Have to Do With Gold?
The Bureau of Labor Statistics releases June inflation data Tuesday, July 14, at 8:30 AM ET. That report will be the primary driver for gold heading into the FOMC meeting on July 28–29.
May CPI showed a 4.2% year-over-year headline reading, the highest since April 2023, driven almost entirely by energy. Energy inflation that month rose sharply and accounted for the majority of the monthly increase. That hotter-than-expected data forced the Fed to revise its 2026 inflation projection upward and boosted market odds of a September rate hike earlier in July.
Since mid-June, however, oil prices eased after a temporary reopening of the Strait of Hormuz and a ceasefire, with crude retreating from earlier 2026 highs. Falling crude pushed gasoline prices down and reduced an important component of headline inflation. If June’s monthly headline CPI prints negative, it would be the first month-over-month decline since 2020 and could meaningfully alter rate-hike expectations.
Several forecasters expect headline CPI to moderate in June. If headline inflation softens, markets will likely reduce the odds of additional rate hikes, which would lower expected real yields and reduce the opportunity cost of holding gold. That reversal would allow gold to recover some or all of today’s losses.
What Are the Three Scenarios for Gold This Week?
Scenario 1 — CPI prints below consensus (headline weaker than expected):
September hike odds fall, real yields compress, and gold likely recovers the ground lost today and could test toward recent resistance levels near $4,130. In this outcome, the Iran headlines look like transitory noise rather than a durable inflation shock.
Scenario 2 — CPI prints in line with consensus:
Markets interpret energy-driven inflation as having peaked. September hike odds hold near current levels, and gold stabilizes without a strong recovery. Attention then shifts to Fed Chair Kevin Warsh’s testimony, which follows the CPI release.
Scenario 3 — CPI prints above consensus:
Rate-hike expectations accelerate, the dollar strengthens, real yields move higher, and gold extends losses toward structural support levels identified by analysts.
What Will Warsh Say That Matters for Gold?
Fed Chair Kevin Warsh testifies before the House Financial Services Committee on Tuesday, July 14, beginning at 10:00 AM ET—ninety minutes after the CPI release—and before the Senate Banking Committee on Wednesday. This is his first congressional testimony since taking office in May 2026, and markets will scan his remarks for guidance on the Fed’s policy path.
Two phrases in Warsh’s opening statement will matter most for gold. If he characterizes recent Iran-related energy price moves as temporary or clearly geopolitical, that suggests the Fed views the spike in energy costs as non-structural and could ease rate-hike expectations. Conversely, if he emphasizes that prices are “too high” without distinguishing the energy-driven nature of recent inflation, that would reinforce higher rate expectations and keep gold under pressure.
Why Does the Structural Case for Gold Stay Intact Regardless?
Interest-rate swings drive near-term price moves, but structural demand and central bank behavior underpin gold’s long-term case. For example, the People’s Bank of China continued to add to its official gold reserves, making sizeable monthly purchases in June 2026. Reserve managers typically operate on a multi-decade horizon, and central bank accumulation can be a structural source of demand independent of short-term rate cycles.
Additionally, the Federal Reserve remains divided on the timing and extent of further tightening. A divided central bank, combined with historically large US debt and rising interest costs, constrains how far and how long real yields can rise without broader economic consequences. Those structural considerations support gold over longer horizons, even if yield dynamics cause temporary price swings.
What Should You Watch Tomorrow Morning?
Two numbers arrive at 8:30 AM ET on July 14. Watch them in order.
First, headline CPI month-over-month. A negative print would confirm the energy-driven reversal and be positive for gold. A positive print would suggest the recent flare-up has broader inflation implications.
Second, core CPI month-over-month, which excludes food and energy and is the metric the Fed watches closely. At +0.3% month-over-month, core inflation is already elevated; any surprise above that level would strengthen the case for further rate hikes and weigh on gold. A surprise below +0.3% would be bullish for gold.
Monitor Warsh’s opening statement at 10:00 AM ET for any shift in tone regarding energy-driven inflation. The sequence—data first, Fed remarks second—will determine how markets trade gold on the day.
SOURCES
1. GoldSilver — Live Gold & Silver Price Charts, data through July 13, 2026.
2. Bureau of Labor Statistics — Consumer Price Index summary, May 2026 and scheduled June 2026 release.
3. CME FedWatch Tool — market-implied rate-hike probabilities, July 2026.
4. Federal Reserve — FOMC minutes and Summary of Economic Projections, June 2026.
5. State Administration of Foreign Exchange (SAFE) — official gold reserves data, June 2026.
6. Bloomberg and other financial news outlets reporting on central bank purchases and energy price moves.
7. US Treasury Fiscal Data and Congressional Budget Office summaries on federal debt and interest costs.
Disclaimer: This article is for informational purposes only and does not constitute financial or investment advice. Always consult a qualified financial adviser before making investment decisions.
You May Also Like:
- Trump Declared the Ceasefire Over. Gold Barely Moved.
- HSBC Cut Its Gold Forecast by $304. Then Said Gold Will Hit $4,750 by Year-End.
- The Fed Named AI Its Top Inflation Risk. Gold Noticed.
- Five Days From Now, Two Numbers Will Decide Gold’s Second Half
- Bank of America Cut Its Gold Forecast. The Reason Is More Bullish Than It Looks.
- The Fed Is Split 9 to 8. Gold and Silver Are Paying the Price — Until July 14.