Key Takeaways
- Identify the trend first. Use the 200 SMA to establish the long-term direction before applying other indicators. Trading against the long-term trend reduces the likelihood of a well-timed entry.
- Support and resistance are your map. Key price levels — shaped by previous highs and lows, moving averages, and volume clusters — define the market landscape before you enter it.
- RSI and MACD confirm momentum. RSI below 30 signals oversold conditions in silver; above 70 signals overbought. MACD crossovers confirm momentum direction — use them on daily or weekly charts, not intraday.
- Fibonacci retracement guides accumulation. The 38.2%, 50%, and 61.8% retracement levels mark historically high-probability support zones during corrections within an uptrend.
- The gold-silver ratio adds a relative-value dimension. Historically, a ratio above 80:1 has signaled silver is inexpensive relative to gold. In mid-2026, the ratio sits near the middle of its historical range.
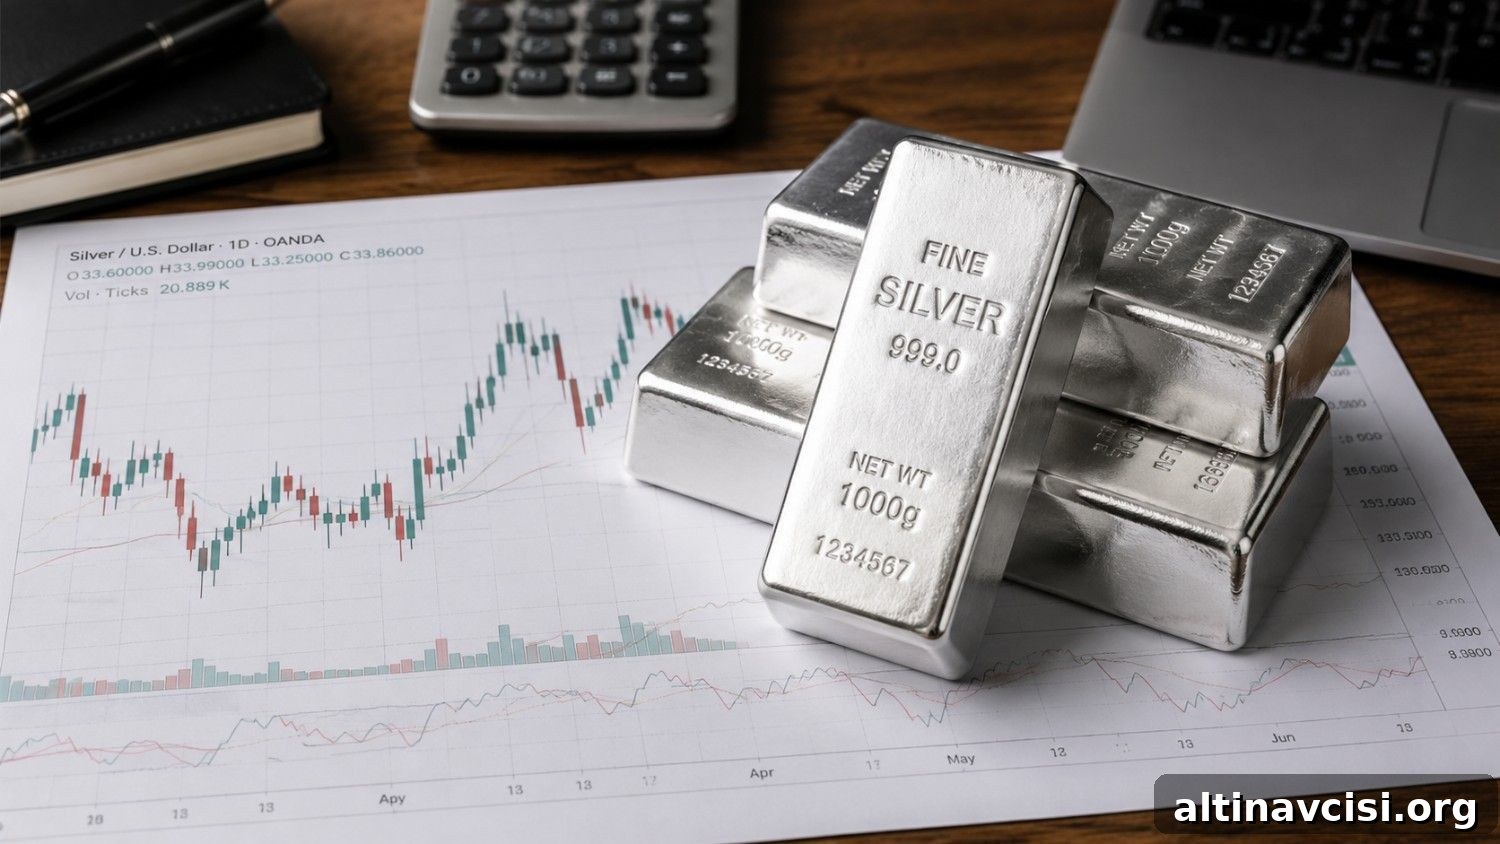
Silver technical analysis is the discipline of reading price charts, volume data, and momentum indicators to determine when silver is oversold, overbought, or approaching a meaningful support or resistance level. It helps investors time entries and exits more effectively while still respecting the rationale for physical ownership.
If you already accept silver’s role in a diversified portfolio, technical analysis answers the practical follow-up: when does the entry price make sense? As of mid-2026, silver traded near recent support after intraday volatility driven by geopolitical news and renewed rate concerns. Interpreting those signals changes how you respond.
The five core steps of silver technical analysis are: identifying the trend, locating key support and resistance levels, reading momentum indicators (RSI and MACD), applying Fibonacci retracement for timing entries, and using the gold-silver ratio as a relative-value overlay. Each step builds on the previous one to form a coherent approach.
Step 1: What Is the First Step in Silver Technical Analysis?
Begin with trend identification. Before any indicator is meaningful, determine the market direction across three horizons: long-term (weekly or monthly charts), medium-term (daily charts), and short-term (4-hour or hourly charts). Each horizon provides a different perspective on momentum and risk.
A practical and simple method uses moving averages. The 200-day simple moving average (200 SMA) is a common proxy for the long-term trend: price above the 200 SMA suggests a bullish long-term backdrop; price below suggests bearish. The 50-day SMA is often used for medium-term context.
Crossovers between the 50 SMA and 200 SMA carry widely followed signals. A 50 SMA crossing above the 200 SMA is known as a golden cross and generally signals bullish potential. The opposite, a death cross, signals possible bearish momentum. These patterns do not guarantee outcomes but serve as useful context.
Two structural factors complicate trend analysis for silver. First, silver is priced in US dollars, so dollar strength or weakness overlays the metal’s supply-demand dynamics. Second, silver has significant industrial demand — semiconductor cycles, solar installations, and electric vehicle production influence price behavior differently than gold. A short-term bearish signal in silver may reflect sector rotation rather than a fundamental shift in monetary value.
Practical rule: Establish your directional bias from the long-term trend, then use shorter time frames to identify tactical entry points within that trend.
The Knowledge That Changes Everything

Two essential guides — yours free. Understand why gold matters and why fiat currencies often lose purchasing power.
Step 2: How Do You Identify Key Support and Resistance Levels in Silver?
Support is a price level where buyers historically outweigh sellers and a floor often forms. Resistance is where sellers dominate and price stalls or reverses. These levels form where significant trading activity occurred previously, leaving a footprint the market revisits.
There are four common methods for identifying support and resistance:
Previous highs and lows. Round numbers and prior peaks or troughs often act as future support and resistance. Historic price zones near major round levels frequently attract attention and influence future price action.
Volume clusters. Areas with heavy historical trading volume tend to represent fair-value zones and can act as future support or resistance when price returns to those regions.
Moving averages. The 50 SMA and 200 SMA can act as dynamic support and resistance as well as trend indicators. A pullback that holds at a long-term moving average is technically meaningful.
Horizontal consolidation zones. Extended sideways trading forms consolidation ranges that serve as reference points for future moves. Wider consolidation zones usually provide stronger support or resistance when revisited.
Step 3: What Are the Best Momentum Indicators for Silver?
After trend and key levels are identified, momentum indicators reveal whether price moves are gaining or losing force and whether extremes are near.
Does RSI Work for Silver?
Yes. The Relative Strength Index (RSI) measures the speed and magnitude of recent price changes on a 0–100 scale. Readings below 30 indicate oversold conditions; above 70 indicate overbought. Because silver is more volatile than gold, some traders prefer slightly wider thresholds (for example, 25/75), but 30/70 remains a common starting point.
RSI divergence—when price makes a new low but RSI forms a higher low—signals weakening downside momentum and often precedes meaningful reversals.
How Does MACD Apply to Silver?
MACD compares two exponential moving averages and plots their difference. A MACD line crossing above its signal line suggests rising momentum; a cross below suggests accelerating downside. For silver, MACD is most reliable on daily or weekly charts. Intraday signals often produce false readings due to silver’s large single-session moves. The MACD histogram also highlights the momentum’s rate of change; a shrinking histogram near resistance warns that buying pressure is fading.
Step 4: What Is Fibonacci Retracement and How Does It Apply to Silver?
Fibonacci retracement levels mark common percentage pullbacks within a larger trend. The standard levels are 23.6%, 38.2%, 50%, 61.8%, and 78.6%. When drawn from a significant low to high, these levels highlight where buying support often appears during corrections.
- 23.6% retracement: Shallow pullback; trend stays strong.
- 38.2% retracement: Moderate pullback; trend intact.
- 50.0% retracement: Midpoint; trend may be in question.
- 61.8% retracement: Deep pullback; the “golden ratio” level and often a strong support in an uptrend.
- 78.6% retracement: Very deep pullback; trend may be broken.
For long-term physical investors, Fibonacci levels serve as disciplined accumulation guides. Corrections to 38.2% or 50% of a multi-month advance often present superior opportunities to add to positions compared with buying on the initial breakout.
Step 5: What Is the Gold-Silver Ratio and Why Does It Matter Technically?
The gold-silver ratio measures how many ounces of silver buy one ounce of gold. It functions as a relative-value overlay: when the ratio is high, silver tends to be cheap relative to gold; when low, silver is relatively expensive. Over multi-year periods, shifts in this ratio can indicate rotational dynamics between the metals driven by industrial demand and monetary flows.
Investors use the ratio to allocate between metals and to spot long-term mean-reversion opportunities. A sustained movement in the ratio provides context that complements price-based technical setups on silver charts.
What Does Silver’s Current Technical Picture Show?
Recent sessions have shown silver testing near-term support after intraday volatility. Failed breakouts above resistance, followed by sharp intraday reversals, create setups where monitoring RSI and volume can indicate oversold conditions and potential stabilization.
Economic releases, such as CPI or labor data, act as short-term catalysts that can push metals one way or the other over one- to two-week horizons. For long-term physical holders, these short-term moves are typically noise; the structural case for ownership remains primary and technical tools are best used to refine entry timing within that framework.
What Are the Limits of Silver Technical Analysis?
Technical analysis works best when it complements, rather than contradicts, fundamentals. Silver’s dual role as both an industrial and monetary metal means industrial demand swings can override chart signals. Silver’s thinner market liquidity compared with gold also means large orders can create outsized moves that look like significant technical events but primarily reflect liquidity dynamics.
Consider time frames carefully: daily charts inform the next few weeks; weekly and monthly charts inform multi-month to multi-year outlooks. Long-term holders should prioritize weekly and monthly analysis and use daily charts only to fine-tune entries.
Stay On Top of Gold & Silver Prices
Get important market alerts sent straight to your inbox.
People Also Ask
Do Candlestick Patterns Work for Silver?
Yes. Candlestick patterns such as the hammer, inverted hammer, engulfing patterns, and doji candles are useful, especially on daily charts. They can signal reversals or indecision when they appear near major support or resistance. Intraday candlesticks on silver can be noisy due to high volatility, so daily patterns offer clearer signals.
How Does Volume Confirm Silver Price Moves?
Volume validates conviction. Breakouts accompanied by high volume are more reliable because participants are committing at new price levels. Breakouts on low volume often fail. Conversely, a sell-off on declining volume suggests selling pressure is easing and may precede stabilization.
Is Technical Analysis Different for Silver Than for Gold?
The same tools apply, but silver requires calibration for higher volatility and a stronger sensitivity to industrial data. Use wider confirmation windows and require more corroborating evidence before acting on signals in silver than you might for gold.
What Are Bollinger Bands and Are They Useful for Silver?
Bollinger Bands plot two standard deviation bands around a 20-day moving average. When bands narrow (“squeeze”), it often precedes sharp directional moves. A squeeze followed by a band break with volume is a cleaner entry signal for silver than a band touch alone.
What Time Frame Should a Long-Term Physical Silver Holder Use?
Weekly charts are the primary frame for long-term physical holders. They filter daily noise and reveal multi-month trends, consolidation zones, and key Fibonacci levels. Use monthly charts for long-term context and daily charts only to refine entry timing once the weekly setup is confirmed.
SOURCES
1. GoldSilver — Live Silver Price Chart
2. GoldSilver — Live Gold Price Chart
3. LBMA — Precious Metal Prices and Data
4. CME Group — Silver Futures Market Data
5. World Gold Council — Gold Prices and Data
6. The Silver Institute — Silver Supply and Demand
Disclaimer: This article is for informational purposes only and does not constitute financial or investment advice. Consult a qualified financial adviser before making investment decisions.
You May Also Like:
- Who Controls the Gold Market? Meet the Five Banks That Settle Every Ounce
- How the Jobs Report Moves Gold and Silver: The Five-Step Chain Behind Every Move
- What Is Profit Booking in Gold and Silver? The Mechanism Explained
- Gold Technical Analysis: A Complete Investor’s Guide
- The Anatomy of a Premium: Why Gold and Silver Never Trade at Spot
- Peak Gold: Why Can’t Gold Mine Supply Keep Up With Demand?
- How Is Gold Taxed When You Sell It? The 28% Collectibles Rule Explained