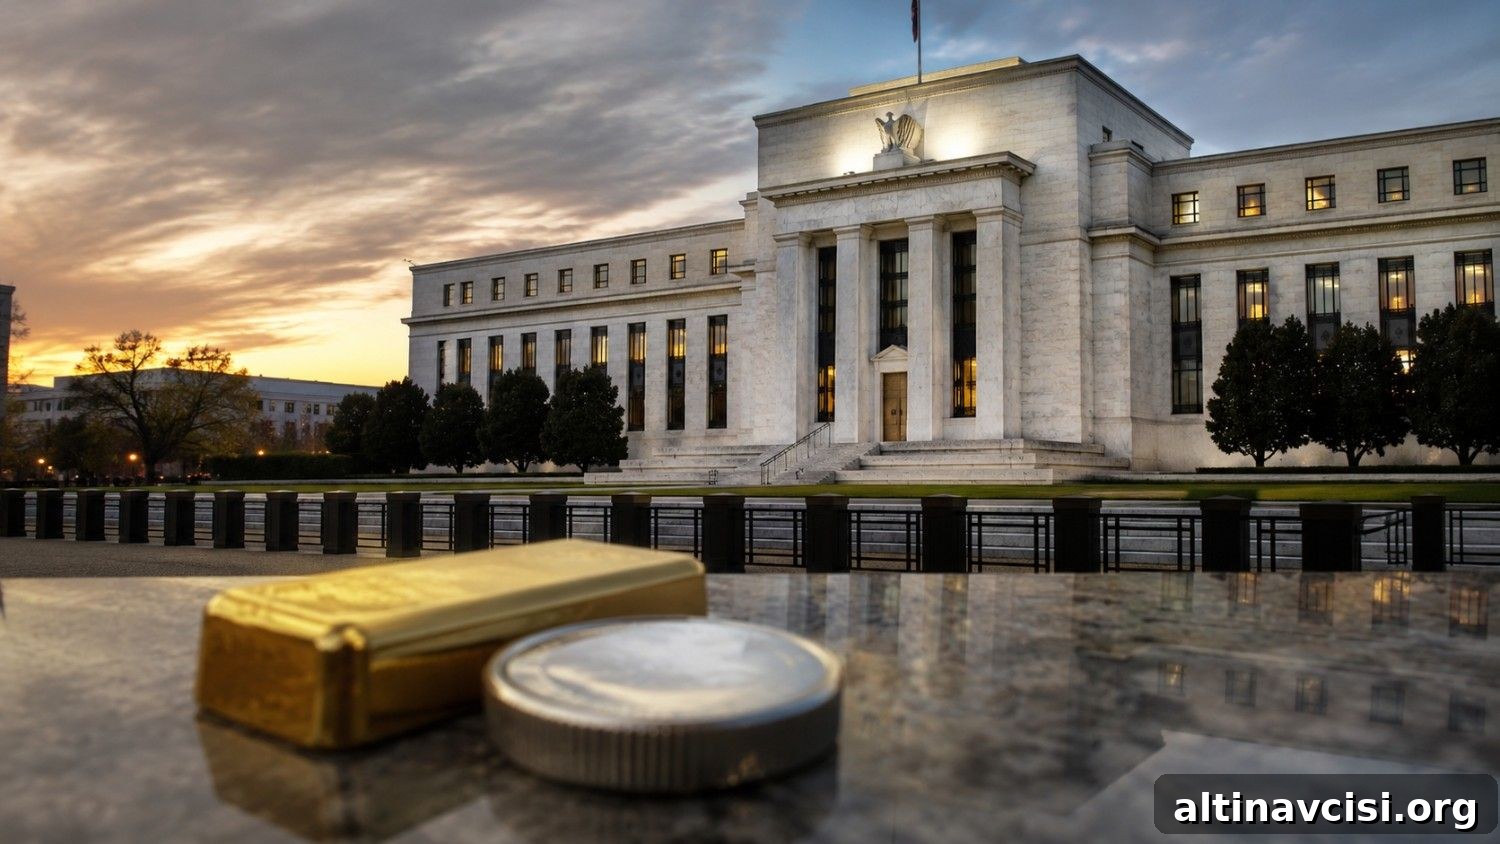
The Federal Reserve published the minutes from Chair Kevin Warsh’s first meeting on July 8, 2026, at 2:00 p.m. ET. By late afternoon on that day, gold traded near $4,075, down about 0.75%, while silver was around $58.27, off roughly 2.83%. Both metals are well into correction territory: gold sits about 27% below its January all-time high of $5,589, and silver is roughly 52% below its January peak of $121.64.
While the minutes were not the lone cause of those price moves, they clarified the policy outlook and highlighted the single key figure that will determine the next market direction for precious metals.
What Did the FOMC Minutes Show?
At the June 16–17 meeting, the Federal Open Market Committee unanimously left the federal funds rate unchanged at 3.50%–3.75%. That decision was widely anticipated. The minutes, however, revealed important details about committee thinking that matter for investors in gold and silver.
Of the eighteen participants who submitted economic projections, nine expected at least one rate increase before year-end, eight expected no policy change, and one projected a cut. Notably, Chair Warsh did not submit a dot-plot projection — the first Fed chair to omit that estimate since the dot-plot was added to the Summary of Economic Projections in January 2012.
Three points in the minutes are especially relevant for precious-metals holders. First, most participants rejected language that had implied an easing bias; the Fed signaled it has stepped away from suggesting imminent rate cuts. Second, nearly all participants who flagged upside inflation risk indicated that some additional policy tightening would likely be appropriate if inflation remains elevated — a near-consensus stance rather than vague upside-risk commentary. Third, a majority of participants warned that persistently high inflation could begin to affect longer-term inflation expectations, a concern that has not been emphasized since 2022. Staff projections also raised core PCE sharply in a single quarter, while trimming GDP growth, signaling a model that now foresees slower growth alongside stickier inflation.
The Edge Every Investor Needs
Smarter precious metals investing starts here. The Nuggets Newsletter delivers essential market insight, Fed developments, global trends, and educational coverage to help you stay informed.
Why Did Gold and Silver Fall After the Minutes?
The minutes coincided with a separate geopolitical shock. On July 8, a public declaration ending the Iran ceasefire at a NATO summit in Ankara was followed by renewed airstrikes and a more than 5% jump in oil prices. Those developments reinforced a familiar chain that pressured metals during 2026: a spike in oil boosts inflation expectations, which raises the likelihood of Fed hikes, lifting real yields and weighing on gold and silver.
Measured against the World Gold Council’s mid-year valuation framework, gold’s fair value sits near $4,100 (plus or minus 5%), a range based on an expectation of one Fed hike by October 2026 and inflation peaking near 3.9%. At about $4,075, gold is just under that band but not decisively below it, suggesting the market remains within the model’s expected range.
Silver suffered a larger sell-off because it depends on two demand drivers. Roughly 58% of annual silver demand is industrial—used in solar panels, semiconductors, and electric-vehicle components—so a hawkish Fed that cools growth directly reduces industrial demand. The remaining share behaves more like a monetary metal, reacting to changes in real yields similar to gold. Both drivers were hit by the July 8 developments, pushing the gold-to-silver ratio near 70, well above its long-term average near 60. That elevated ratio reflects an outsized discount on silver relative to gold rather than a fundamental market breakdown.
What Does July 14 Decide for Gold and Silver?
The next critical data point is the June Consumer Price Index, scheduled for release on Tuesday, July 14, at 8:30 a.m. ET. May’s CPI registered 4.2% year-over-year, a level that contributed to the Fed’s hawkish shift in June. If June’s CPI remains at or above roughly 4.0%, market odds for a September rate hike will climb back toward the mid-60s percentage range, keeping real yields elevated and maintaining pressure on both metals. If the June CPI falls below about 3.8%, the dynamic could reverse: expectations for hikes would ease, real yields would likely decline, and gold and silver could regain lost ground. Under that scenario, upside targets such as J.P. Morgan’s fourth-quarter 2026 gold forecast of $4,500 would become more attainable, and the gold-to-silver ratio near 70 would likely contract toward its historical mean.
One factor that is independent of short-term US data is China’s ongoing gold accumulation. In June 2026, the People’s Bank of China added nearly 15 tonnes to its reserves—the largest monthly purchase since October 2023—extending a buying streak of multiple months. That activity represents a strategic, multi-year reserve policy rather than a direct response to any single Fed meeting or minutes release, and it supports the longer-term case for gold.
In summary, the FOMC minutes confirmed a visible short-term headwind for precious metals by making a hawkish tilt explicit and highlighting inflation risks. They did not, however, overturn the structural demand signals for gold and silver. For now, July 14’s CPI print is the next decisive number to watch.
SOURCES
1. Federal Reserve — Minutes of the Federal Open Market Committee, June 16–17, 2026
2. Federal Reserve — Summary of Economic Projections, June 2026
3. Bureau of Labor Statistics — Consumer Price Index Summary, May 2026
4. Bureau of Labor Statistics — Employment Situation Summary, June 2026
5. CME Group — FedWatch Tool, September 2026 Rate Hike Probabilities
6. World Gold Council — Gold Mid-Year Outlook 2026: Point Break
7. Silver Institute — World Silver Survey 2026: Supply and Demand Data
8. GoldSilver — Live Gold and Silver Spot Prices, July 9, 2026
9. Commerzbank analysis and market commentary on PBoC gold purchases, June 2026
10. TD Economics — U.S. FOMC Meeting June 16–17, 2026: Analysis and Key Takeaways
Disclaimer: This article is for informational purposes only and does not constitute financial or investment advice. Always consult a qualified financial adviser before making investment decisions.
You May Also Like:
- Gold Is Sitting on $4,000. The World Gold Council Has a Model for What Happens Next.
- Trump Called the Deal Dead. Oil Jumped 6%. Gold Fell. Here Is Why Both Moves Make Perfect Sense.
- China Just Bought Its Most Gold Since 2023. It Did It During the Quarter Gold Fell 16%.
- Iran Struck the Mediator’s Tanker. Gold Fell. The Funeral Ends Thursday.
- BofA Says the Stock Market Is About to Snap Back. Gold Is Down 3% This Year. Do the Math.
- Warsh Sat Out the Dot Plot. The FOMC Minutes Drop Wednesday.