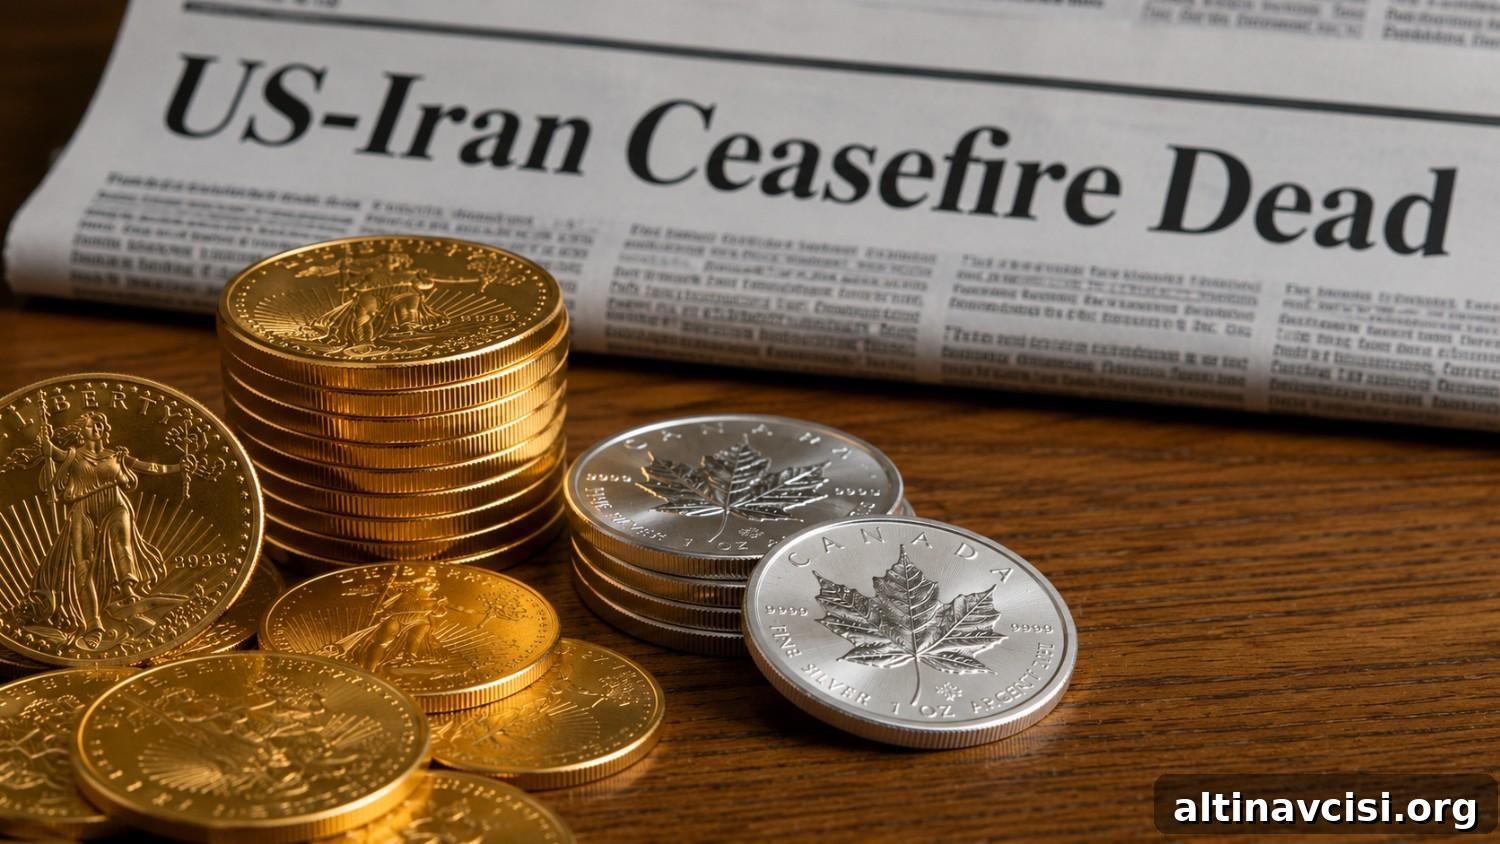
At the NATO summit in Ankara on the morning of July 8, 2026, President Trump declared the US-Iran ceasefire “over.” Oil prices surged more than 6% on the announcement, while gold fell $34 to $4,072 and silver dropped 2.5% to $58.45. That reaction — a geopolitical escalation coinciding with lower gold prices — may seem counterintuitive at first, but it reveals an important and repeatable relationship between energy shocks, inflation expectations, real yields and precious metals.
Why Did Gold Fall When a War Escalated?
The reason is straightforward: a sharp rise in oil prices is inflationary, and higher inflation today can keep monetary policy tighter for longer. In 2026, that dynamic has proven damaging for gold.
On July 7 Iran reportedly struck three commercial ships in the Strait of Hormuz. The U.S. military responded with strikes, and the next morning President Trump characterized further engagement with Iran as “a waste of time.” The market reaction was immediate: Brent crude jumped to roughly $78.80 a barrel, a move of about 6.3% that pushed energy costs higher across the economy.
Higher energy prices tend to raise headline inflation. When inflation risks rise, the Federal Reserve generally adopts or maintains a more hawkish stance to prevent inflation from becoming entrenched. A hawkish Fed supports higher nominal yields. More important for gold, it supports higher real yields — that is, Treasury yields after subtracting expected inflation.
Gold does not yield interest or dividends. When real yields are positive and rising, the opportunity cost of holding gold increases relative to interest-bearing assets like Treasury bonds. That shifts capital toward fixed income and away from gold, exerting downward pressure on gold prices. That mechanism explains why a geopolitical event that lifts oil can simultaneously push gold lower.
This same chain of causation has been at the heart of gold’s correction in 2026. Gold fell from an intraday spot high near $5,589 on January 29 to a June low around $4,002 — a drawdown near 28%. May’s consumer price index reading showed headline inflation running at 4.2% year-over-year, driven largely by energy, and many Federal Open Market Committee participants anticipated at least one more rate increase during the year. The recent oil shock is not a new structural force; it is confirmation that the inflation-real-yield mechanism remains active.
The Edge Every Investor Needs
Smarter precious metals investing starts with clear, timely information. Market-moving news, central bank activity, and macro updates matter — and understanding the links between them helps investors act with confidence.
Why Is Silver Falling Harder Than Gold?
Silver has fallen more sharply than gold: roughly 2.5% versus gold’s 0.83% move on the same session, widening the gold-to-silver ratio to about 69.7 from roughly 67.0 the prior week. The reasons are rooted in silver’s dual role as both a monetary and an industrial metal.
Like gold, silver is sensitive to real yields. But unlike gold, about 58% of annual silver demand is industrial — it is used in solar panels, electric vehicles, defense electronics and semiconductors. When an oil-driven inflation shock raises manufacturing costs and threatens production, industrial demand for metals like silver can weaken. That adds an extra downside impulse for silver compared with gold.
The gold-silver ratio moved above 72 during June’s lows before compressing to around 67 after a labor-market report reduced expectations for additional Fed hikes. Today the ratio is widening again. Historically, ratios above 80 have signaled attractive entry points for long-term physical silver buyers, but that is a historical observation rather than a timing signal.
Has the Structural Case Changed?
No. The recent escalation and oil spike strengthen a near-term headwind, but they do not overturn the larger structural factors that have supported precious metals throughout 2026.
Sovereign and central bank demand remains an important backdrop. Net central bank purchases were sizable in Q1 2026, and several major institutions continued buying gold into mid-year. Global fiscal pressures and large absolute levels of government debt contribute to the narrative that buyers are accumulating long-term safe assets. Those forces are still in place and would likely attract significant buying if prices sustained a move back below key psychological levels.
What Is the Number to Watch?
The most important near-term data point is the June Consumer Price Index, scheduled for release on Tuesday, July 14 at 8:30 a.m. ET. May’s CPI was 4.2% year-over-year and was heavily influenced by energy prices. If June shows cooling — which is plausible if supply or shipping conditions ease — the odds of further rate hikes would fall, reducing the real-yield headwind and helping metals. If June’s reading remains elevated, the pressure on precious metals could intensify.
As of the New York open on July 8, 2026, gold was near $4,072 and silver around $58.45. The immediate force pushing those prices lower is higher real yields driven by oil-inflated CPI. That dynamic is reversible: it subsides when energy prices fall, when CPI cools, or when the Federal Reserve signals a pause or end to tightening. Each of those outcomes is observable and dateable, making them practical indicators for investors to monitor.
SOURCES
1. Axios — Trump Says Iran Ceasefire ‘Over’ and Talks a ‘Waste of Time’ (July 8, 2026).
2. NBC News — U.S. Military Response and Coverage of the Iran Situation (July 2026).
3. Associated Press / ABC7 — Oil Prices Jump After Ceasefire Comments (July 8, 2026).
4. Federal Reserve Board — FOMC Statement and Summary of Economic Projections, June 17, 2026.
5. Bureau of Labor Statistics — Consumer Price Index, May 2026; June 2026 CPI scheduled July 14, 2026.
6. World Gold Council — Gold Mid-Year Outlook 2026; Gold Demand Trends Q1 2026.
7. SAFE — China PBoC Gold Reserves, June 2026 reporting (July 7, 2026).
8. US Treasury Fiscal Data — Debt to the Penny, July 2026.
9. IMF — Currency Composition of Official Foreign Exchange Reserves (COFER), 2026.
10. Silver Institute — World Silver Survey 2026.
Disclaimer: This article is for informational purposes only and does not constitute financial or investment advice. Consult a qualified financial adviser before making investment decisions.
You May Also Like:
- China Just Bought Its Most Gold Since 2023. It Did It During the Quarter Gold Fell 16%.
- Iran Struck the Mediator’s Tanker. Gold Fell. The Funeral Ends Thursday.
- BofA Says the Stock Market Is About to Snap Back. Gold Is Down 3% This Year. Do the Math.
- Warsh Sat Out the Dot Plot. The FOMC Minutes Drop Wednesday.
- Gold Digest: Five Institutions Just Said the Same Thing About the Selloff
- Gold Hits 3-Week High as Fed Hike Odds Halve on Jobs Miss
- The Jobs Report Missed. The Unemployment Rate Fell Anyway. Gold Didn’t Buy It.