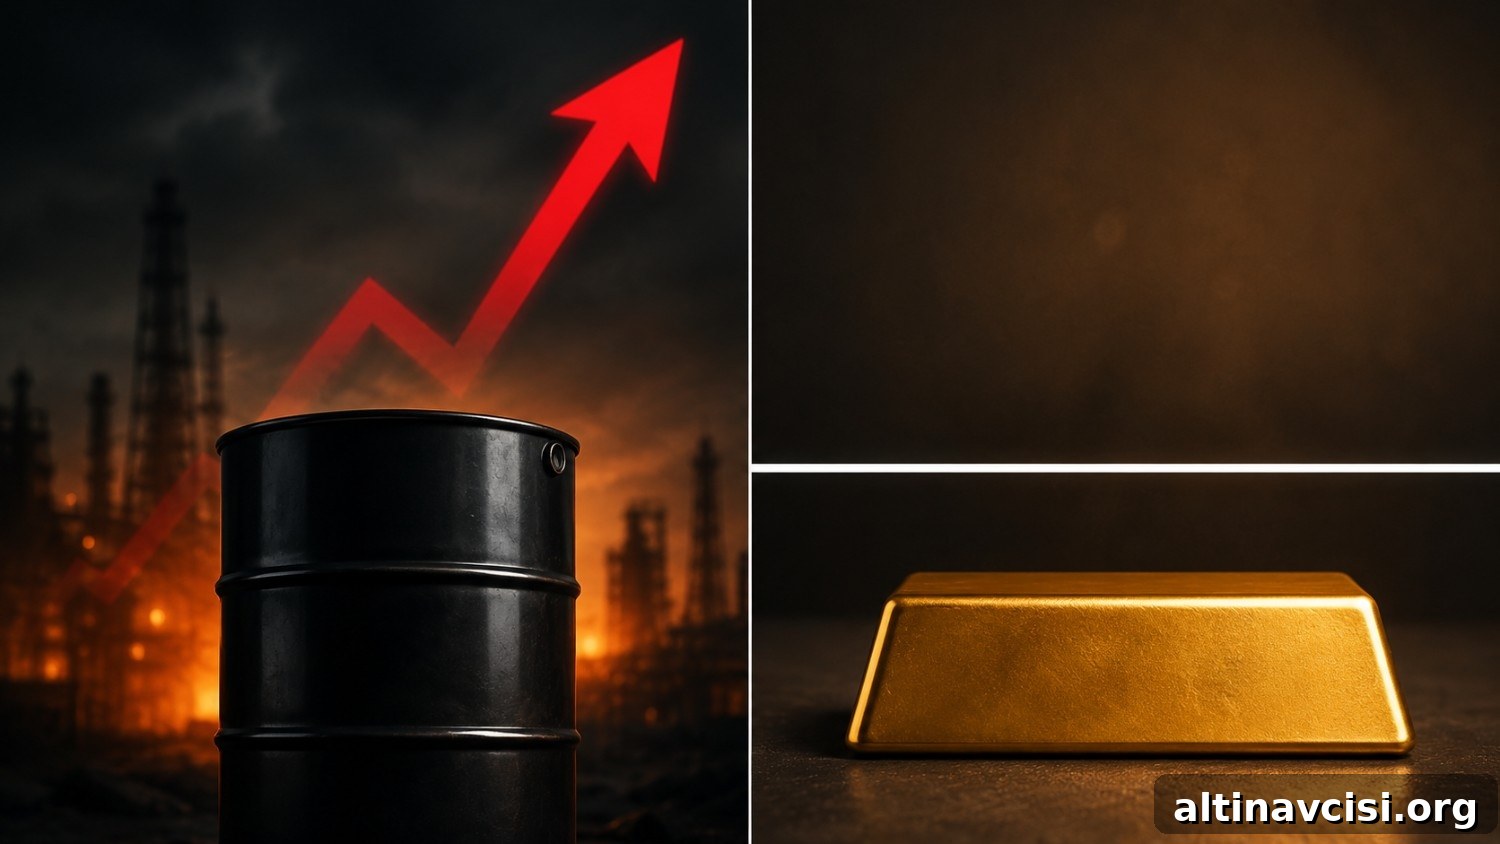
Oil has climbed more than 9% in five trading days. Vessel traffic through the Strait of Hormuz has plunged—crossings are roughly 52% lower week-on-week—and U.S. airstrikes on Iranian positions have continued for a fourth day. By the familiar logic that gold protects against inflation, you might expect gold to be soaring right now.
Instead, gold is trading near $4,052 per ounce—little changed on the day and down about 8% over the past 30 days.
That apparent disconnect is not a market error. It reflects how gold actually functions in financial markets: gold reacts primarily to monetary conditions, not to every form of price pressure or short-term supply shock.
Source: goldsilver.com — 30-day gold spot price (Jun 15 – Jul 15, 2026)
Why Is Oil Rising While Gold Stays Flat?
Both oil and gold are often described as inflation hedges, but they respond to different types of inflation. Oil reacts to physical supply disruptions. When tankers cannot transit a key choke point like the Strait of Hormuz, barrels don’t reach buyers and the physical scarcity pushes crude prices up. That is supply-chain inflation—immediate, tangible, and tied to logistics and geopolitical risk.
Gold, in contrast, responds primarily to monetary inflation: the long-term erosion of purchasing power driven by expanded money supply, persistent fiscal deficits, and central-bank policies. A short-term supply shock that reduces barrels in transit does not create new money; it raises prices in the real economy but does not directly trigger the monetary dynamics that push gold higher.
In short, an oil spike is exactly the kind of event that can lift consumer prices without immediately moving the monetary signals gold tracks.
The Edge Every Investor Needs
Smarter precious-metals investing begins with clear information. The Nuggets newsletter highlights market moves, Fed signals, global trends and education for thoughtful investors.
How Does an Oil Spike Hurt Gold Prices?
Higher energy costs feed into headline inflation metrics. When consumer price indexes rise, central banks may feel pressure to tighten policy to slow inflation. Expectations of higher short-term interest rates push up real yields—yields adjusted for inflation—which increase the opportunity cost of holding non-yielding assets such as gold. As real yields rise, institutional investors often reduce allocations to gold in favor of yield-bearing instruments.
That sequence is what markets are pricing now. Futures and options markets show elevated odds of additional rate action later in the year, a stance that has been reinforced by the oil-led pickup in inflation risk. This effect can offset or even reverse the immediate impulse for investors to buy gold in response to geopolitical uncertainty.
So while oil spikes raise near-term inflation readings, they can produce tighter financial conditions that are unfavorable for gold in the short term. Gold understands that dynamic—and that is part of why it is relatively flat despite geopolitical strain and higher energy prices.
What Does the Gold-Oil Divergence Actually Mean for Long-Term Holders?
A key nuance many observers miss is that the very forces currently working against gold are often the same forces that later reinforce its case. Central banks can raise rates to counter oil-driven inflation, but higher policy rates increase debt-service costs for governments. The United States already carries large public debt, and every incremental rate increase raises annual interest payments on that debt by substantial amounts.
That fiscal reality imposes a limit on how high and how long rates can sustainably remain. History shows that after major tightening cycles, pressure from rising debt costs and other economic constraints eventually forces central banks to ease again. When they do, real yields fall and the conditions that favor gold—currency debasement concerns and lower real returns on cash and bonds—return.
Physical gold holders typically position for that longer arc, not for every short-term headline. The oil spike creates near-term paper pressure on gold prices, but it does not change the structural motivations behind owning physical metal.
Where Do Gold and Silver Stand Right Now?
Gold is trading around $4,052 per ounce, roughly 28% below its January intraday peak of $5,589. Silver sits near $58.29 per ounce, well below its record high of $121.62. Both metals have retreated from recent tops, but the underlying supply-and-demand stories remain intact.
Silver’s structural deficit persisted for multiple years through 2025 and looked set to continue into 2026, producing a cumulative shortfall measured in hundreds of millions of ounces. Meanwhile, the gold-to-silver ratio remains historically elevated—near 69:1—indicating silver is cheap relative to gold by long-term standards.
Central banks continue to add to gold reserves, fiscal deficits remain substantial, and monetary expansion has not reversed. The Hormuz disruption is a short-term geopolitical shock; it changes near-term price dynamics but does not alter the broader factors that support precious metals over time.
Gold’s lack of a big move today is not a failure of its role as a monetary hedge. It is the market functioning as designed: responding to evolving monetary signals and weighing immediate geopolitical risks against the path of interest rates and fiscal policy.
Stay On Top of Gold & Silver Prices
Receive concise market alerts and timely updates in your inbox.
SOURCES
1. U.S. Bureau of Labor Statistics — Consumer Price Index, June 2026 (CPI release).
2. GoldSilver — 30-day gold and silver price data (price charts), accessed July 15, 2026.
3. CME Group — FedWatch tool and implied rate-hike probabilities, July 2026 data snapshot.
4. Kpler / market reporting — Strait of Hormuz vessel transit and shipping disruptions, July 2026 reporting.
5. Silver Institute — World Silver Survey 2026 (Metals Focus).
6. U.S. Department of the Treasury — Debt data and fiscal statistics, July 2026 snapshot.
Disclaimer: This article is for informational purposes only and does not constitute financial or investment advice. Consult a qualified financial professional before making investment decisions.
You May Also Like:
- Gold and Fed Policy: When the System Picks Winners
- Warsh Testified. Gold Jumped $90. The Signal Everybody Missed Was in His Report.
- Gold Jumped $90 This Morning. June CPI Just Explained Why.
- Silver Fell 3.8% Today. Gold Fell 2.9%. The Gap Has a Name.
- Trump’s Hormuz Toll Is an Inflation Tax. Here’s Why Gold Fell.
- Gold Fell 1.4% on an Iran Strike. One Number Tomorrow Morning Could Change Everything.