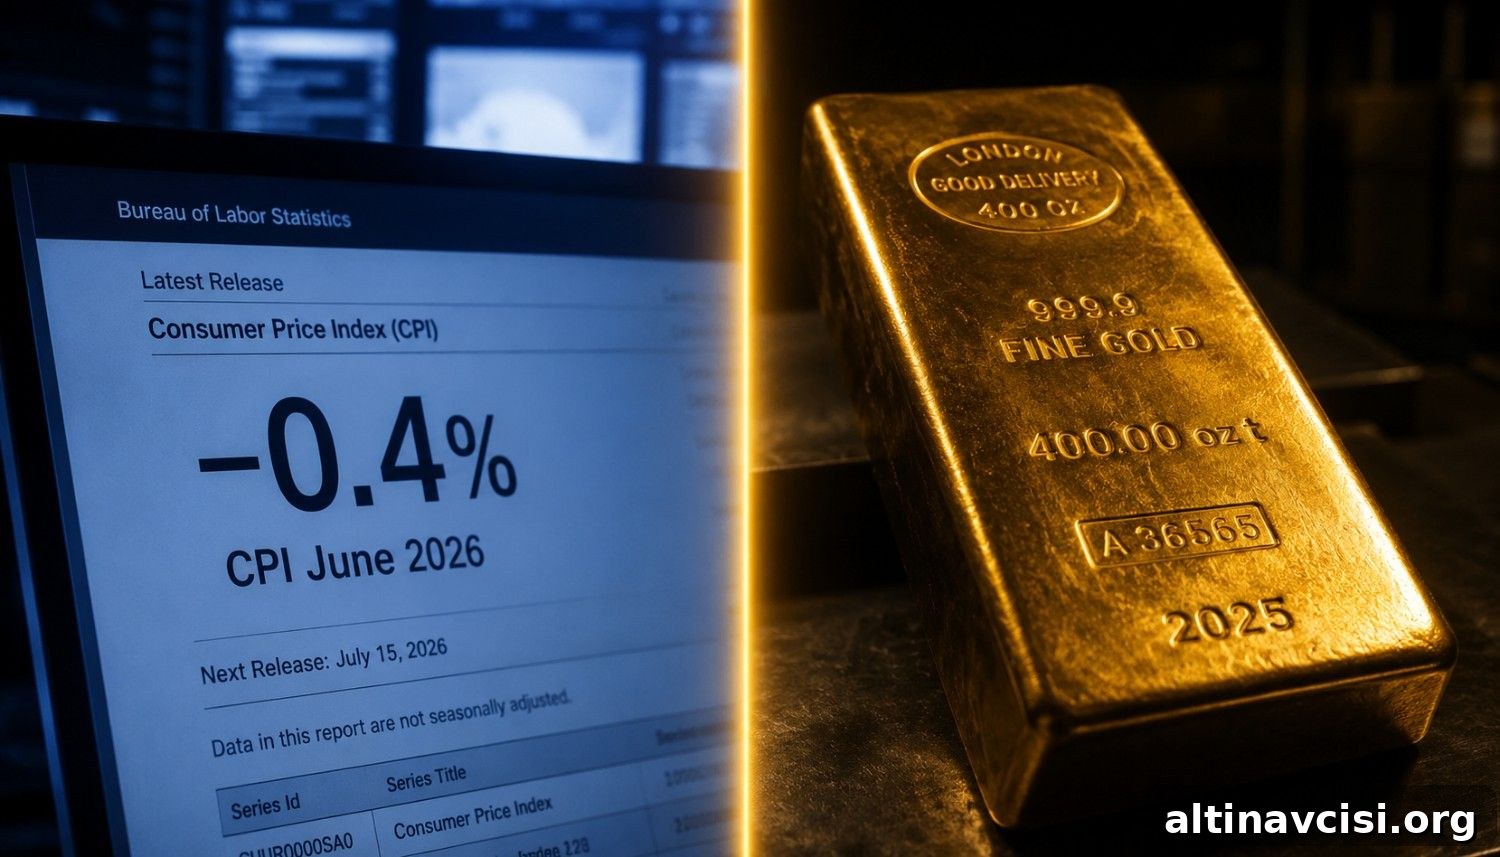
June inflation registered the largest single-month decline since April 2020. The Consumer Price Index fell 0.4 percent on a seasonally adjusted basis in June — a much larger drop than the 0.1 percent decline economists had expected. The headline move was driven almost entirely by a near 10 percent collapse in gasoline prices after a temporary Iran ceasefire briefly reopened the Strait of Hormuz.
What Did the Gold Price Do After June CPI?
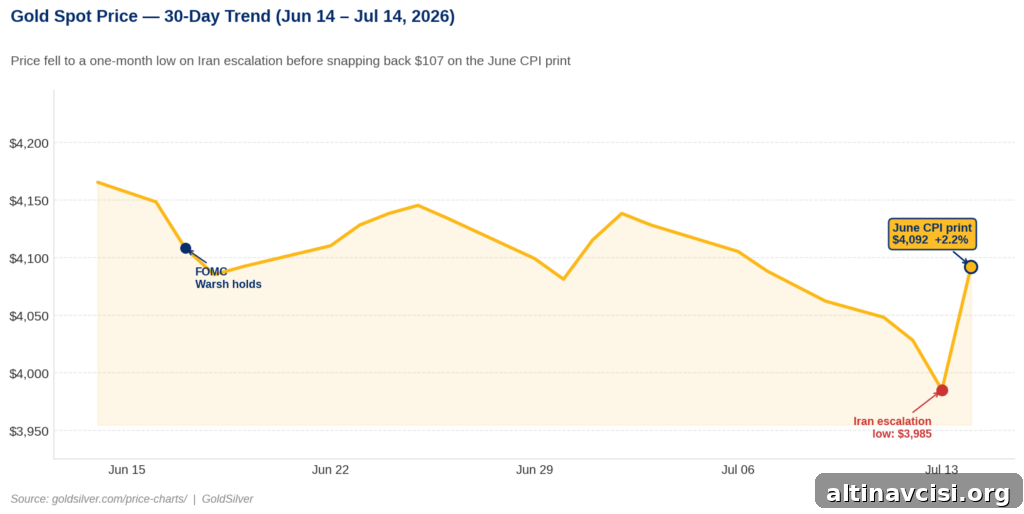
The reaction in precious metals was immediate. Gold climbed to approximately $4,091 per ounce, up about $90 or 2.25 percent as markets digested the softer inflation print. That move reversed losses from earlier trading when a spike in geopolitical risk had pushed gold lower. Silver followed, rising to roughly $59.39, gaining around 3 percent on the session. These moves reflect a rapid re-pricing of expectations about interest rates and real yields after the CPI release.
Why Did June CPI Send Gold Higher?
The link runs through real yields. Gold is a non-yielding asset, so its opportunity cost—what investors forego by holding gold instead of interest-bearing assets—moves with real interest rates. Real yields equal nominal Treasury yields minus expected inflation. A sharp fall in inflation reduces the case for additional Federal Reserve tightening, which typically lowers nominal yields and compresses real yields. When real yields fall, the relative cost of holding gold declines, often driving higher gold prices.
In recent policy discussions, roughly half of the Federal Open Market Committee participants had signaled at least one more rate increase was possible before year-end. That hawkish tilt weighed on gold through June and early July. A softer-than-expected CPI reading, especially a flat core reading, gives policymakers who favor pausing further hikes more cover. Market pricing for a September hike is likely to be revised down as traders absorb the new data.
The Edge Every Investor Needs
Smarter precious metals investing starts here. The Nuggets Newsletter delivers market insights, policy updates, global trends, and educational material.
What the Headline Number Isn’t Telling You
The headline decline merits careful scrutiny before declaring victory over inflation. The entire monthly drop was driven by energy — specifically a 9.7 percent fall in gasoline prices. Shelter inflation still rose, recording a 0.1 percent gain, the smallest monthly increase since January 2021. Core CPI was flat for the month, which sounds reassuring but is mixed in meaning: it indicates underlying demand-driven inflation in services, wages and housing did not accelerate further, but it has not clearly reversed either.
Importantly, the geopolitical situation that produced the gasoline decline has already changed. The ceasefire that prompted the June drop ended on July 8. Subsequent U.S. military strikes on Iranian targets have lifted oil prices back toward the levels that pushed May’s headline CPI up by 4.2 percent. In short, the energy-driven relief recorded in June’s report is already unwinding. July’s CPI, released in August, is likely to reflect this renewed pressure on energy prices.
Does One Good CPI Print Change the Structural Case?
No. The broader structural dynamics that keep price pressures alive remain intact. Core CPI running at about 2.6 percent year-over-year still sits well above the Federal Reserve’s 2 percent target. The Fed is operating with a policy rate in the 3.50–3.75 percent range while shelter inflation has risen substantially over the past year and certain travel-related categories, such as airline fares, have seen large percentage gains. The central bank faces a dilemma: inflation remains above target while energy markets are geopolitically vulnerable, limiting how aggressively policymakers can tighten without risking other economic damage. That constraint keeps real yields relatively constrained, which supports gold whether interest rates hold steady or rise slowly.
The Second Corner: Why This Print Is Backward-Looking
A key point many headlines will miss is that CPI measures are always backward-looking snapshots. June’s CPI measures conditions in June, when the Iran ceasefire reduced shipping risk and gasoline prices fell. That geopolitical condition no longer holds. The Strait of Hormuz is again contested and oil prices are responding. The inflation relief in June therefore reflects a temporary pause in an otherwise fragile environment.
Further, monetary policy is a blunt tool against oil supply shocks. Raising interest rates can slow demand, but it cannot restore disrupted supply routes or reopen a strategic waterway. That mismatch between the source of the inflation (an energy supply shock) and the instrument the Fed uses to fight inflation (interest rates) explains why the central bank remains constrained. In such circumstances, real assets outside the financial system, including physical precious metals, can preserve purchasing power when monetary policy cannot directly address supply-driven price increases.
What to Watch Next
Near-term market drivers include public commentary from key policymakers and the upcoming Federal Open Market Committee meeting. Fresh testimony from Fed officials in the days after the CPI release can shift market expectations. A measured, data-dependent tone would help sustain the relief rally in metals, while a hawkish framing focused on persistent core inflation and renewed energy risks would likely limit further gains. The FOMC meeting at the end of July and the June personal consumption expenditures (PCE) report, published later in the month, are additional important milestones. The PCE index is the Fed’s preferred inflation gauge, so markets will closely watch that print for confirmation or contradiction of the CPI signal.
Stay On Top of Gold & Silver Prices
Get important market alerts sent straight to your inbox.
SOURCES
1. Bureau of Labor Statistics — Consumer Price Index — June 2026 (USDL-26-1191, July 14, 2026)
2. Bureau of Labor Statistics — Consumer Price Index — May 2026 (USDL-26-0824, June 10, 2026)
3. Federal Reserve — FOMC Statement and Summary of Economic Projections, June 17, 2026
4. CME Group — FedWatch Tool — September 2026 Rate Probability, July 14, 2026
5. Live Gold & Silver Spot Prices, July 14, 2026
Disclaimer: This article is for informational purposes only and does not constitute financial or investment advice. Consult a qualified financial adviser before making investment decisions.
You May Also Like:
- Silver Fell 3.8% Today. Gold Fell 2.9%. The Gap Has a Name.
- Trump’s Hormuz Toll Is an Inflation Tax. Here’s Why Gold Fell.
- Gold Fell 1.4% on an Iran Strike. One Number Tomorrow Morning Could Change Everything.
- Trump Declared the Ceasefire Over. Gold Barely Moved.
- HSBC Cut Its Gold Forecast by $304. Then Said Gold Will Hit $4,750 by Year-End.
- The Fed Named AI Its Top Inflation Risk. Gold Noticed.