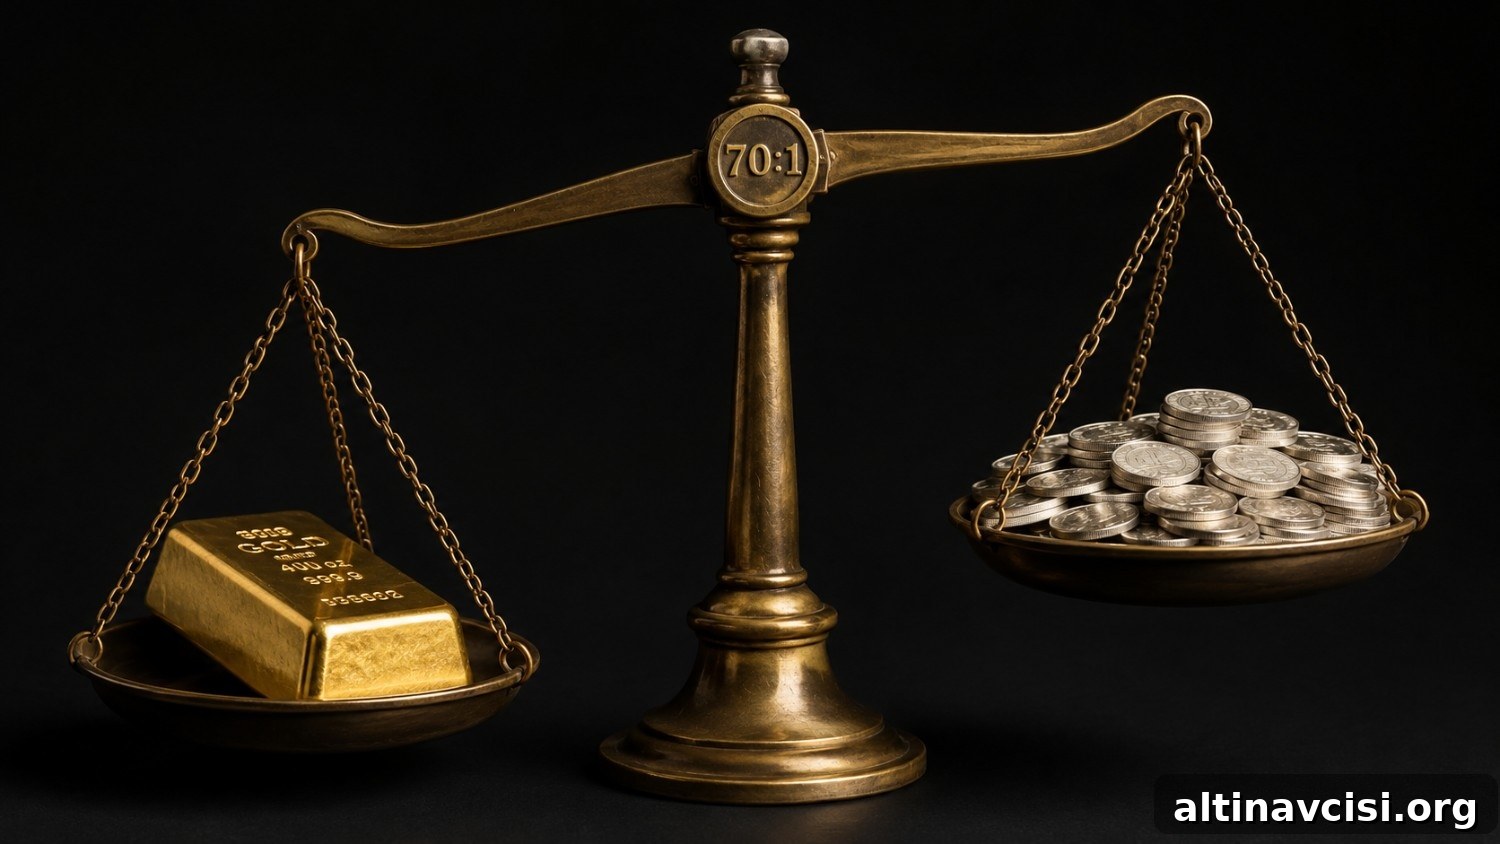
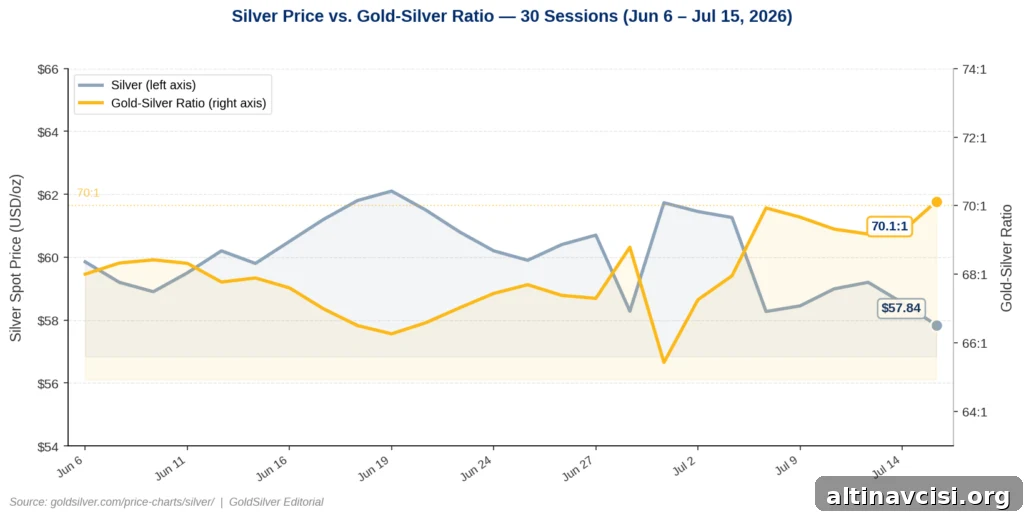
Gold and silver usually move in tandem, but today they diverged. Gold closed essentially unchanged, up less than 0.1%, while silver fell 1.4% to $57.84 an ounce. That move pushed the gold-silver ratio to roughly 70:1, meaning one ounce of gold now buys about 70 ounces of silver. This level sits near the upper end of the ratio’s range over the past two years and highlights a meaningful relative underperformance by silver.
Why Does the Gold-Silver Ratio Matter for Investors?
The gold-silver ratio shows how many ounces of silver are required to buy one ounce of gold. With spot gold near $4,056 and silver at $57.84, the ratio sits around 70:1. Historically, this ratio has swung widely — from roughly 30:1 at the tightest to about 127:1 at the widest extremes. The March 2020 spike to historic levels occurred during COVID-19 market panic. While 70:1 is not unprecedented, it signals that silver has lagged gold and that each metal is responding to different market forces today.
The Edge Every Investor Needs
Smarter precious metals investing starts with clear, timely information. Subscribe to concise market insights, Fed updates, global trends, and educational analysis focused on gold and silver.
What Is Driving Silver’s Underperformance Today?
Silver’s demand profile is dual: it serves as both an industrial metal and a monetary/precious metal. Roughly 58% of silver demand is industrial — used in solar panels, semiconductors, electric-vehicle components, and medical devices — according to recent industry surveys. That industrial exposure ties silver partly to expectations for global economic growth. When investors become concerned that higher interest rates will curb growth, silver’s industrial demand outlook weakens, hurting its price.
In July 2026, that dynamic is clear. The Federal Reserve’s policy path remains uncertain, with the FOMC scheduled to meet later this month. Market pricing currently assigns a high probability to a rate hold in July but still leaves significant odds for further tightening in September. That lingering uncertainty suppresses industrial-demand expectations and disproportionately pressures silver relative to gold.
Gold, by contrast, is driven primarily by monetary factors: central bank purchases, institutional allocations, and investor demand for a hedge against purchasing-power erosion. Those drivers are less sensitive to near-term GDP growth. Recent downside surprises in inflation data eased some real-yield pressure on gold, giving it a modest boost. Silver saw the same monetary tailwind but lost ground on the industrial side, producing a net decline for the metal while gold held steady.
What Do Analysts Say About Silver’s Setup?
Despite the ratio moving to 70:1, many institutional analysts have kept their longer-term price targets for silver intact. Major forecasts commonly point to mid-to-high $70s or low $80s per ounce for 2026 in base-case scenarios, which would narrow the ratio back toward historical averages if gold remains near current levels. Analysts generally describe the recent weakness as a recalibration of timing rather than a permanent change in fundamentals.
The structural supply story also supports the bullish case for silver. Industry reports show consecutive annual supply deficits in recent years, with cumulative above-ground drawdowns absorbing substantial volumes of metal. That persistent structural deficit means physical supply constraints remain relevant even when short-term macro uncertainty temporarily weighs on prices.
The Real Story Behind the Ratio: Two Signals Running at Once
The divergence between gold and silver today reflects two simultaneous signals. Gold is signaling that inflation pressures have eased and that central-bank buying and monetary demand remain supportive. Silver is signaling concern about economic growth and the prospect that industrial demand could soften if policy rates remain elevated. Both messages can be true at the same time, and the widening ratio captures that tension.
Historically, when the ratio expands beyond 70:1, silver has often reasserted itself once rate uncertainty resolves, sometimes outperforming gold as industrial demand rebounds and investors rotate back into the metal. Past episodes show that the recovery mechanism for silver can be amplified because it benefits from both monetary and industrial demand once conditions improve.
For holders of physical silver, a 70:1 ratio represents a market that is pricing in outsized downside risk to economic activity. That view may prove correct or may be overly cautious; either way, the current relative price offers a historical entry point for investors who believe in silver’s dual-demand structure and the longer-term supply fundamentals.
What Should Silver Investors Watch Next?
Key near-term events will shape the next leg for both metals. The FOMC decision on July 28–29 and the June personal consumption expenditures (PCE) inflation report on July 30 are the main calendar items. A Fed hold combined with a soft PCE print would likely reduce rate-hike odds and could compress the gold-silver ratio. Conversely, continued pricing for additional hikes would keep a headwind on silver’s industrial outlook.
Investors should also monitor the 10-year Treasury yield, currently hovering near the mid-4% range. A sustained decline in the 10-year yield would ease real-yield pressure and typically benefits both metals, with silver historically showing a larger percentage response on the upside relative to gold. Watching industrial indicators and manufacturing data will also help gauge the health of silver’s industrial demand engine.
Stay On Top of Gold & Silver Prices
Receive concise market alerts and updates delivered to your inbox.
SOURCES
1. GoldSilver — Live Silver Spot Price, July 15, 2026
2. GoldSilver — Live Gold Spot Price, July 15, 2026
3. Silver Institute — World Silver Survey 2026
4. Bureau of Labor Statistics — Producer Price Index, June 2026, July 15, 2026
5. CME Group — FedWatch Tool, July 2026 FOMC Rate Probabilities
6. Federal Reserve — Chairman Warsh Semiannual Monetary Policy Testimony, July 14–15, 2026
Disclaimer: This article is for informational purposes only and does not constitute financial or investment advice. Consult a qualified financial adviser before making investment decisions.
You May Also Like:
- Gold Holds as CPI and PPI Both Miss. Here’s Why.
- Gold Is Flat. Oil Is Up 9%. Here’s Why.
- Gold and Fed Policy: When the System Picks Winners
- Warsh Testified. Gold Jumped $90. The Signal Everybody Missed Was in His Report.
- Gold Jumped $90 This Morning. June CPI Just Explained Why.
- Silver Fell 3.8% Today. Gold Fell 2.9%. The Gap Has a Name.