

The U.S. economy delivered its strongest monthly reading in more than five years, yet gold retreated. The same report that sparked the selloff also contains signals suggesting the decline may be temporary.
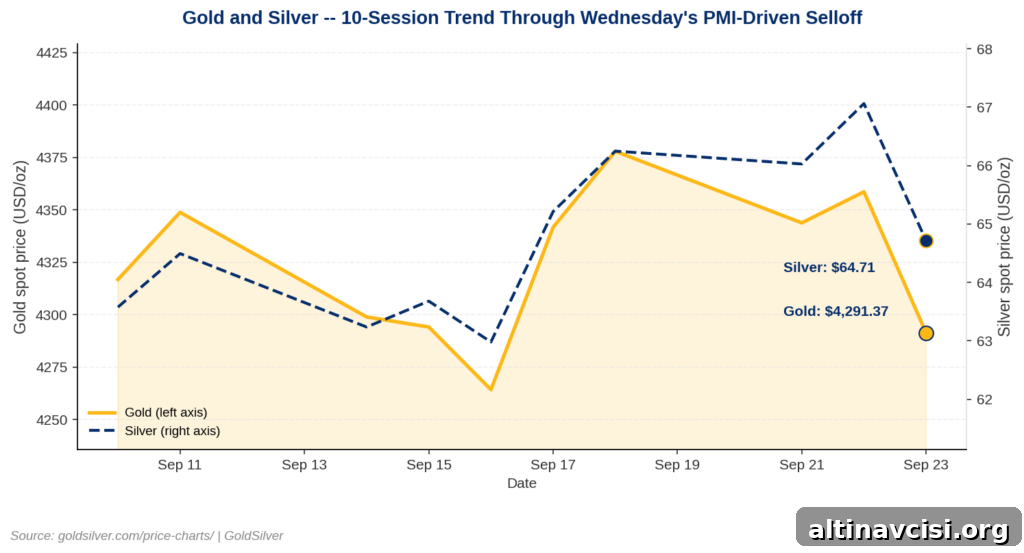
Gold is trading at $4,291.37, down 1.53% on the day. Silver is at $64.71, down 3.51%. Prices reflect live spot data as of 3:18 p.m. UTC on Wednesday, September 23, 2026.
Key Takeaways
- Gold fell 1.53% to $4,291.37 and silver fell 3.51% to $64.71 after S&P Global’s flash Composite PMI printed 58.4, a 62-month high that exceeded the 55.2 forecast.
- The same PMI shows input costs rising at their fastest pace in four years, and order backlogs are at their most severe level outside the pandemic in nearly two decades—classic signs of demand-driven inflation that the market has not fully priced into precious metals.
- Platinum (-4.37%) and palladium (-3.10%) also dropped alongside gold and silver. Because these metals have distinct industrial demand profiles, the synchronized decline points to a broader dollar-and-interest-rate reaction rather than metal-specific weakness.
What Did Today’s PMI Report Actually Show?
S&P Global’s flash U.S. Composite PMI rose to 58.4 in September, up from 56.0 in August and well above the 55.2 consensus. According to S&P Global, this is the strongest pace of U.S. business activity in 62 months. Services led the expansion, climbing to 58.7 from 56.5, while manufacturing output accelerated to 57.0 from 53.9—its best reading since May 2022.
S&P Global’s chief economist described the data plainly: U.S. business activity is booming, with output growing at its fastest clip in over five years.
Markets reacted quickly. Gold plunged to intraday lows minutes after the 9:45 a.m. ET release. The immediate move reflects the conventional response: a large upside surprise on activity increases the likelihood of further Federal Reserve rate hikes. With the cost of holding non-yielding assets like gold rising relative to yield-bearing instruments, investors sold metal into the spike in growth and rate expectations. That is the straightforward mechanism behind today’s price action.
Why Might the Selloff Be Missing Half the Story?
There is an important nuance in the same PMI release that has not been fully reflected in market prices: input costs and backlogs are climbing sharply. The report shows input prices rising at their fastest pace in four years, and order backlogs increased at the steepest rate since May 2022. In fact, the backlog reading is the most severe outside the pandemic in the survey’s near-20-year history. S&P Global warned this creates pricing power for firms and represents a risk to the inflation outlook.
Those signs point to demand-driven inflation—precisely the kind of inflationary pressure that normally supports gold. Gold’s traditional role is as a hedge against currency debasement and rising consumer prices, since it does not offer a coupon or yield but preserves real value over time. In short, the same document that pushed gold down on the growth surprise also contained inflationary evidence that should, in theory, support bullion.
Right now the market appears to have focused on the growth beat and the higher odds of Fed tightening, while the inflation signals from the same release have yet to be fully priced into metals. That disconnect—growth-driven selling on one hand and emerging inflationary pressure on the other—is the central story today.
Does the Rest of the Complex Confirm This Is a Macro Move?
Yes. Platinum dropped 4.37% and palladium fell 3.10%, both larger moves than gold’s decline. These metals do not share silver’s exposure to solar panels, electronics, or AI hardware, nor do they benefit from central-bank bullion purchases like gold. Their main industrial use is in automotive catalytic converters, a different demand base entirely.
When four different precious metals with distinct demand drivers move down together, the most plausible explanation is a macro-driven push—shifts in the U.S. dollar and rate expectations—rather than isolated weakness in any single metal. That pattern reinforces the view that today’s PMI print and the resulting adjustment in rate expectations were the primary market movers.
What Does This Mean for Someone Holding Physical Gold or Silver?
This environment is emblematic of the tension between nominal interest-rate moves and underlying inflation pressures. If the Fed raises rates into a supply-constrained expansion—one where real inflation continues to build—nominal yields could rise while real purchasing power of currency falls. That scenario favors holding inflation-resistant assets such as physical gold or silver.
Today’s price decline reflects the market trading the growth aspect of the PMI release first. It does not necessarily change the structural case for owning precious metals. In fact, the same report provided fresh evidence of rising input costs and order backlogs—factors that strengthen the rationale for holding non-yielding stores of value. The market may simply be late to price that inflationary half of the story.
What Should Investors Watch Next?
Key indicators to monitor in the coming days include the 10-year Treasury breakeven inflation rate, which stood near 2.33% as of September 22. A rise in the breakeven rate would suggest markets are beginning to price the inflation component of the PMI release.
Near-term data to watch: weekly jobless claims and the Fed’s H.4.1 balance sheet release on Thursday, followed by the University of Michigan’s final September inflation-expectations reading on Friday. These releases can influence rate expectations and, in turn, precious-metals prices.
Also relevant are geopolitical developments and major diplomatic meetings this week that can affect dollar strength and metal flows. Such events can amplify or offset the macro forces revealed in economic data, layering additional sensitivity onto metal prices.
SOURCES
1. S&P Global Market Intelligence — Flash US Composite PMI Press Release, September 23, 2026
2. CME Group — FedWatch Tool data and market-implied rate probabilities
3. Federal Reserve Bank of St. Louis — 10-Year Breakeven Inflation Rate (T10YIE)
Disclaimer: This article is for informational purposes only and does not constitute investment advice. Past performance is not indicative of future results. Consult a qualified financial advisor before making investment decisions.
You May Also Like:
- Gold Fell 1.7% Today. Silver Fell 3.6%. Five Signals Point at the Dollar, Not Demand.
- Xi Lands in Washington. Gold and Silver Both Retreat, and Silver Falls Harder.
- UBS Holds Its Silver Target. The Market Already Got There First.
- China Imported Over 1,000 Tonnes of Gold in Eight Months; Central Bank Purchases Remain Small.
- Fed Officials Turn Hawkish. Gold’s Iran-Diplomacy Bounce Faces Headwinds.