2027 Gold and Silver Outlook: Forecasts, Risks, Key Signals

Research as of November 5, 2026
The 2027 outlook for gold and silver depends on which forecasts you consult and what each one measures. Some institutions expect lower annual averages, while others anticipate a recovery later in the year. For anyone holding physical bullion, the most relevant questions are what drives those forecasts and how ownership costs affect net returns.
Important differences go beyond headline prices. Gold’s outlook is driven largely by monetary and investment demand: central banks, exchange-traded funds and retail bullion buyers. Silver is influenced by those factors as well, but industrial consumption, recycling and mine supply also play a major role. These forces can push the two metals in different directions even when both react to changes in the dollar or interest rates.
This article summarizes dated forecasts available in early November, places them in context, and explains what they mean for someone who plans to hold coins or bars for years.
The Knowledge That Changes Everything

Two essential guides — free. Learn why gold matters and why fiat currencies have failed repeatedly over time.
What are the main gold and silver forecasts for 2027?
All figures below are in nominal U.S. dollars per troy ounce. They are not adjusted for inflation and do not include retail premiums for coins or bars.
Who is forecasting the average price for the whole year?
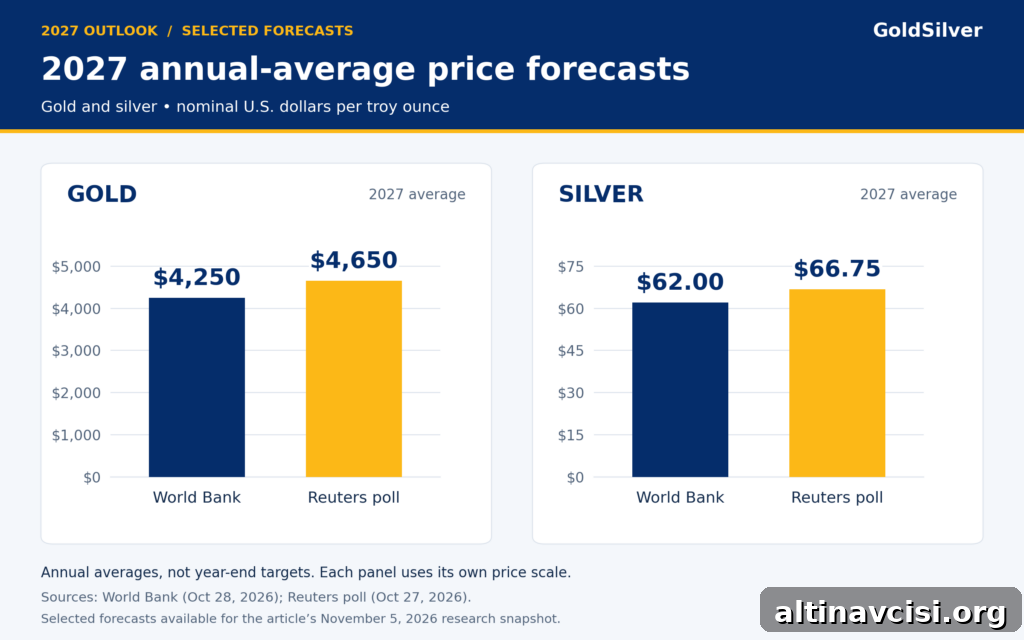
The World Bank’s October 28 outlook projects 2027 annual averages of $4,250 for gold and $62 for silver, both lower than its projected 2026 averages. These numbers are annual averages across 2027 and do not describe the return from buying bullion today.
A Reuters poll published October 27 points to higher 2027 annual averages: $4,650 for gold and $66.75 for silver. Reuters reports median survey estimates, again reflecting average prices across the full year rather than year-end targets.
What do the models, targets and scenarios show?
Different forecasts use different methods and timeframes. UBS Chief Investment Office’s October 20 outlook gives a dated target of $5,400 gold by September 2027. WisdomTree’s model published October 29 projects $4,789 for gold by Q3 2027, and its October 22 silver model projects $70.55 for silver in Q3 2027. These model outputs are conditional on their macro inputs and assumptions.
State Street’s November monitor presents a bearish 12-month gold scenario in the range of $3,750–$4,500. That is a downside risk case within its set of scenarios rather than a base forecast. Taken together, these outlooks illustrate a wide band of possible outcomes; their differing periods and methods should not be averaged into a single headline number.
Why can a lower annual average coexist with a recovery?
An annual average reflects the full year’s price path. A dated target is a predicted level at a specific point. A metal could start 2027 weak and then recover later in the year, yet still record a lower annual average than in a stronger 2026. Conversely, a strong start can lift the yearly average even if prices fall by year-end. Neither measure alone tells you the path between your purchase and a future sale.
For anyone holding physical metal, that path matters when it intersects with a cash need. A five-year holding plan does not make an unfavorable sale in year two harmless if funds are required then. Forecasts help frame uncertainty but cannot substitute for a personal holding-period decision.
What could support or weaken gold in 2027?
Gold’s monetary role gives it a unique demand profile compared with industrial commodities. Because gold yields no interest, changes in alternative returns matter. Buyers compare gold with currencies and interest-bearing assets as well as with other stores of value.
Why do real interest rates and the dollar matter?
Real interest rates—the yield on interest-bearing assets after inflation—affect the opportunity cost of holding non-yielding gold. If real yields rise, interest-bearing assets become more attractive and gold can be pressured. If real yields fall, gold’s relative appeal increases. Inflation alone is not determinative: a rise in inflation could raise nominal yields faster than inflation expectations, lifting real yields and weighing on gold, or vice versa.
The dollar also matters because gold is priced in dollars. A stronger dollar typically makes dollar-priced metal more expensive for buyers using other currencies, which can dampen international demand. The policy response to inflation and the currency move together determine the net effect on gold.
What does the latest demand evidence show?
The World Gold Council’s November 3 report estimated 321 tonnes of net purchases by central banks and official institutions in Q3 2026. Global ETF and similar holdings rose by 211 tonnes in the quarter, while bar-and-coin demand reached 268 tonnes, down about 19% from Q3 2025. A follow-up update on November 5 noted a further 19-tonne increase in global gold ETF holdings during October. These are historical flows, not forecasts for 2027.
The distinction is important: central banks and institutional funds can support demand even when retail bullion demand softens. Strong official buying does not eliminate the possibility of price declines if other sources of demand weaken. For 2027, how central-bank purchases, ETF flows, retail demand and macro variables interact will determine the price path.
Is silver’s supply deficit story still the right starting point?
Silver’s price is influenced by both investment and industrial demand. Industrial applications tie silver to manufacturing cycles and technology, but rising installations do not always translate into proportionate silver demand—manufacturers can reduce silver intensity or substitute other materials when feasible.
The Silver Institute’s April 15, 2026 release, based on Metals Focus, reported that industrial silver demand declined by 3% to 657.4 million ounces in 2025, while mine production rose 3% to 846.6 million ounces and recycling increased 2% to 197.6 million ounces. More recent commentary from Metals Focus on October 29, 2026 projected a narrowing deficit in 2026 followed by a return to surplus in 2027. That projection challenges the idea that recent deficits must continue, but it is a forecast—not a certainty—and it does not specify what price level would make a surplus likely.
Market balances count particular demand categories and may treat investment demand separately. Above-ground inventories and investors’ willingness to buy or sell also influence prices. A reported surplus does not automatically force prices down, nor does a reported deficit guarantee gains if inventories or other demand sources bridge the gap.
WisdomTree’s October 22 silver model highlights competing forces: potential support from rising gold prices countered by industrial headwinds, substitution and recycling. The takeaway for physical holders is to examine both investment and industrial sides of the silver market rather than assume industrial demand alone will lift prices.
How should our earlier forecasts be read?
Earlier coverage of gold and silver forecasts records how views evolved. Each forecast must be read with its original date and horizon. A target dated for 2026 or a scenario out to 2030 cannot be treated as a 2027 forecast simply because it appears in the same article. Dated individual calls—such as a high-profile figure predicting much higher gold by a specific date—illustrate the range of opinion but do not create institutional consensus.
When comparing forecasts, keep the publication, date, period covered and the assumptions used in view. That context makes it easier to judge whether a revision meaningfully changes the outlook.
What does the comparison mean for physical owners?
Gold and silver can serve overlapping but distinct roles in a portfolio. Gold’s monetary demand may remain resilient even if manufacturing weakens; silver may benefit from stronger industrial activity but is also vulnerable to substitution and recycling flows. Their prices can diverge and the gold-to-silver ratio simply describes their relative pricing, not absolute value.
For existing owners, the key question is whether the reasons for holding each metal still match the risks now visible. For new buyers, ask whether the position could withstand a disappointing year without forcing a sale. A higher forecast number alone does not answer these questions.
How can a 10% spot gain become a 2.7% return?
Premiums, dealer bid/ask spreads and custody costs matter. For example, if you buy $1,000 of metal at spot but pay a 5% purchase premium, your outlay is $1,050. If spot later rises 10% to $1,100, and the dealer’s resale bid is 2% below spot, you would receive $1,078. That $28 gain over the $1,050 cost equals roughly a 2.7% holding-period return, before considering storage, insurance, shipping or taxes. This simple example shows why understanding premiums and pricing is essential alongside any price forecast.
Physical ownership also requires custody decisions. Holding metal at home carries different theft, loss and insurance risks than professional storage. Over longer holding periods, these practical arrangements and their costs become more important.
What evidence would meaningfully change this outlook?
A meaningful update would change a key assumption: revised central-bank or investment-demand data that strengthens or weakens gold’s case; new industrial, recycling or inventory data that shifts the silver balance; or a large, persistent move in real yields or the dollar. When a forecast is revised, understanding the reason behind the change matters: a lower target driven by a different interest-rate assumption tells a different story than one driven by weaker physical demand.
Stay On Top of Gold & Silver Prices
Get timely market alerts delivered to your inbox.
Live price widget not embedded in this version.
People Also Asked
No. The report collects different types of forecasts—annual-average surveys, institutional targets, conditional models and risk scenarios—that use different methods. It is more useful to compare those categories separately than to seek a single consensus number.
No. A Metals Focus projection of a 2027 surplus is an expectation about supply and demand, not a certainty. Prices also depend on investment demand, inventories and how market participants react. A projected surplus weakens the automatic shortage argument but does not determine next year’s price path.
Central-bank purchases can support gold, but they do not guarantee a floor. Other buyers and sellers, real interest rates and currency moves still influence prices. Official buying also does not determine what an individual bullion owner receives after premiums and transaction costs.
No. Forecasts generally refer to market metal prices. Your sale proceeds depend on product type, metal content, condition, dealer bid and transaction costs. Purchase premiums are not automatically recovered when you sell.
No. A higher target alone is insufficient. Its starting point, period and assumptions matter, along with the risk of disappointment. Your intended holding period, access to cash, custody options and ownership costs should all factor into the decision.
SOURCES
1. CERN — ALICE Detects the Conversion of Lead into Gold at the LHC
2. GIA — Difference Between Natural and Laboratory-Grown Diamonds
3. GoldSilver — How Gold Is Mined
4. Marathon Fusion — Growing Fusion’s Fuel Supply While Co-Producing Gold
5. National Archives — Executive Order 11825: Revocation of Executive Orders Pertaining to the Regulation of the Acquisition of, Holding of, or Other Transactions in Gold
6. Federal Reserve Bank of Richmond — Gold and Silver: Frequently Asked Questions
7. The Royal Mint — Bullion Investing Jargon Buster
Disclaimer: This article is for informational purposes only and does not constitute investment advice. Past performance is not indicative of future results. Always consult a qualified financial advisor before making investment decisions.
You May Also Like:
- Gold Vault Storage: Inside a Brink’s Vault
- What Backs the US Dollar Today?
- Silver Price Outlook October 2026: Fed Hold Is Locked
- Gold Price Outlook October 2026: Pullback & Fed Decision
- Long-Term Gold Ownership: The Case for Holding Gold
- How Higher Silver Prices Can Create a Cash-Flow Squeeze for Recyclers
- Why Are Central Banks Buying So Much Gold in 2026?
- Proof Gold Coins: Same Gold, So Why the Bigger Price?
Popular Topics
Picked from the archive
-
01
 Topics
When to Sell Gold During a Bull Market Pullback
-
02
Topics
Silver Price Nears 2026 Low Again as Investors Stay Calm
-
03
Topics
Silver Eagle vs Maple Leaf vs Britannia: Which Has More Silver?
-
04
Topics
PCE Inflation Hits 4.1%: Why Gold Prices Rose
-
05
Topics
France Completes Gold Repatriation, Germany Set to Follow
-
06
Topics
China’s Biggest Gold Buy Since 2023 as Prices Fall 16%
-
07
Topics
Gold and Silver Rally Today, Defying Market Theory
-
08
Topics
Rising PCE Inflation, Sluggish Growth, and a Lingering Oil Crisis