Why Did Silver Drop 5%? What the Gold-Silver Ratio Reveals

KEY TAKEAWAYS
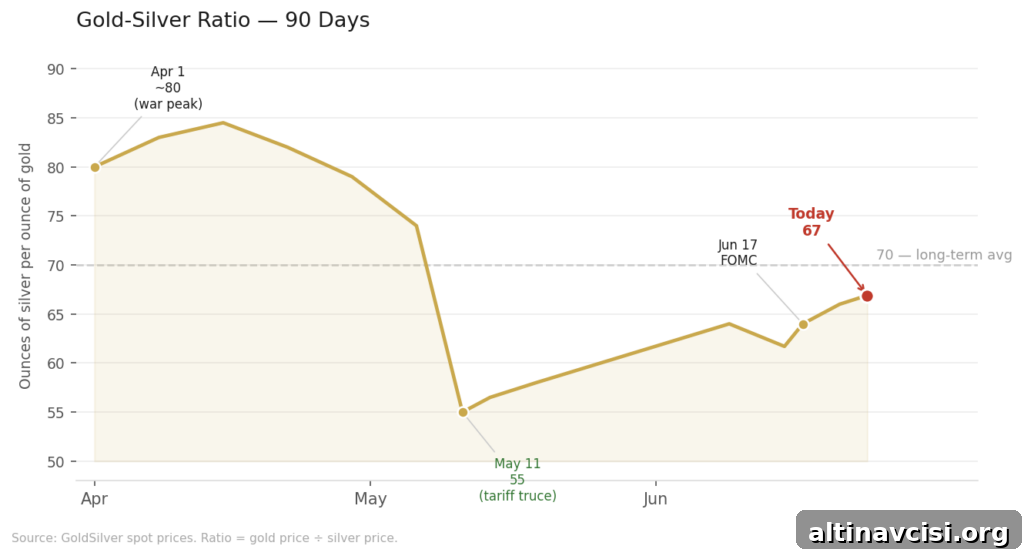
- The gold‑to‑silver ratio reached roughly 67:1 on June 24, 2026 — the widest gap since the peak weeks of the Iran conflict.
- Gold is down about 1.7% while silver has fallen roughly 5.4%. The divergence highlights rate‑hike worries outweighing the Iran peace dividend for now.
- Nine of 18 FOMC officials project at least one rate increase before year‑end. CME FedWatch puts the odds at roughly two‑thirds. Gold’s central‑bank demand is providing a structural floor that silver lacks.
- May PCE is released Thursday, June 25, at 8:30 a.m. EDT. Consensus is 4.1% year‑over‑year. That print will influence whether rate‑hike odds extend or reprice.
- The structural drivers for silver — ongoing supply deficits, industrial demand from solar and EVs, and fiscal pressures — remain intact. The ratio is reflecting short‑term monetary headwinds, not a breakdown of fundamentals.
Gold is down about 1.7% today and silver roughly 5.4%. That gap is visible in the gold‑silver ratio, which climbed to around 67 on June 24, 2026. This metric is acting less as a valuation signal right now and more as a real‑time diagnostic of which market force is dominant. The Iran peace agreement should have helped silver. Instead, near‑term Fed rate expectations are the stronger influence today — and Thursday’s PCE reading explains why.
This article explains why silver is falling harder than gold today, what a 67 gold‑silver ratio measures, and how the upcoming PCE report could change that dynamic.
Why Are Gold and Silver Moving in Opposite Directions?
Many investors use the gold‑silver ratio as a valuation tool: it shows when silver is cheap relative to gold or vice versa. That approach is useful — and recently the ratio sat near 64. But when the ratio moves sharply, it can also reveal which macro force is dominating the market.
On June 24, 2026 the ratio hit about 67:1, meaning it takes roughly 67 ounces of silver to buy one ounce of gold. That figure is signaling a clear tension: the Iran peace dividend is lowering oil prices and should ease inflation, but stronger Fed tightening expectations are counteracting that relief.
Two competing forces are pulling precious metals differently right now: monetary factors driven by real yields and Fed policy, and industrial demand that supports silver. Identifying which force is winning explains the current price spread.
What Happened to the Iran Peace Deal — and Why Didn’t It Help Silver?
The positive development is straightforward: the US and Iran agreed on a 60‑day roadmap and the US granted Iran a license to sell oil again. Shipping through the Strait of Hormuz is normalizing and oil prices have eased as a result. Lower oil should, in theory, help silver by reducing inflationary pressure and thereby easing the Fed’s path.
But in mid‑June the Federal Reserve’s FOMC meeting — the first under Chair Kevin Warsh — revised inflation projections higher, and a significant portion of committee members signaled at least one rate increase before year‑end. Major banks subsequently adjusted their forecasts to price at least one hike and CME FedWatch shows roughly a two‑thirds probability of at least one increase. That changed the near‑term calculus: the Iran‑driven oil relief exists, but it hasn’t yet outweighed the market’s reassessment of Fed policy.
Put simply: the ratio is pointing to a dominant rate‑hike narrative. The peace dividend is real, but not yet powerful enough to offset the tightening signal from the Fed dot plot and market repricing.
Why Is Silver Falling More Than Gold?
Silver is driven by two distinct engines. One is monetary — reaction to real yields, inflation expectations, and the dollar — which it shares with gold. The other is industrial demand — from solar panels, electric vehicles, semiconductors, and data centers — which follows manufacturing cycles rather than central‑bank decisions.
When rate‑hike fears rise, silver’s monetary engine stalls because silver earns no yield. A 10‑year Treasury yield near 4.5% competes with a non‑yielding metal, increasing the opportunity cost of holding silver. Gold faces less of this pressure because central banks hold gold as official reserves and continue to buy, creating a long‑term institutional bid. That difference explains why silver has fallen more steeply while gold has held up relatively better.
The 67 ratio is not declaring silver fundamentally broken. It is showing that short‑term, rate‑driven pressure is suppressing silver more than gold right now.
What Does Thursday’s PCE Report Mean for Silver?
The May PCE inflation report is due Thursday at 8:30 a.m. EDT. Consensus expects about 4.1% year‑over‑year for headline PCE, the highest since April 2023, with core PCE (excluding food and energy) forecast around 3.3–3.4%.
Crucially, the May reading captures a period when oil remained elevated because of the Iran conflict. The oil relief from the peace deal will feed into the June PCE, released in late July. That makes the May report backward‑looking: it may still look hot even as conditions are easing. Market reaction will depend on whether investors treat the print as evidence the Fed must act now or as an artifact of past volatility that will fade.
A hotter‑than‑expected print is likely to extend rate‑hike pressure, keep the dollar firm, and maintain a high gold‑silver ratio. A softer print, particularly a lower core PCE, could quickly reduce the odds of year‑end hikes and allow silver to recover faster than gold.
What the Gold‑Silver Ratio at 67 Does Not Tell You
A 67 ratio does not invalidate the structural silver thesis. Six consecutive annual supply deficits remain a material factor. Industrial demand from renewable energy, EVs, and AI infrastructure continues to grow. Those longer‑term dynamics do not disappear because the Fed’s dot plot shifts.
What the ratio does indicate is a real, measurable, rate‑driven suppression of silver relative to gold. For holders of physical silver, the underlying case — no counterparty risk, no margin calls, preserved ounces — remains unchanged. What has changed is the paper price, influenced by short‑term monetary forces.
Historically, a widening gold‑silver ratio driven by rate fears is not necessarily a signal to sell silver. It often means the Fed is the dominant short‑term force; when that force reverses, silver has historically repriced faster than gold. Thursday’s PCE will be the first major test of how long this period might last.
SOURCES
1. Gold and silver spot price data; Trading Economics — Gold & Silver Spot Prices, June 23, 2026.
2. Federal Reserve — Summary of Economic Projections, June 17, 2026.
3. Federal Reserve — FOMC Statement, June 17, 2026.
4. US Treasury; FRED/St. Louis Fed — 10‑Year Treasury Constant Maturity Yield.
5. CME Group — FedWatch Tool, June 2026.
6. FactSet consensus and market commentary — May PCE forecasts, June 2026.
7. Bureau of Economic Analysis — Personal Income and Outlays, April 2026.
8. World Gold Council — Central Bank Gold Reserves Survey 2026.
9. Trading Economics — Coverage of US‑Iran 60‑day roadmap and related oil developments, June 2026.
Disclaimer: This article is informational only and is not financial or investment advice. Consult a qualified financial professional before making investment decisions.
You May Also Like:
- BofA Says Three Rate Hikes. Silver Just Priced In the First One.
- Iran Deal, Falling Oil, and Why Gold Remains Elevated.
- PCE Drops Thursday: What It Means for Precious Metals.
- Gold Target Adjustments and What the Gap Implies.
- Market Signals from Holiday Trading: What to Watch.
- Half the Fed Favors a Hike While Many Central Banks Continue Buying Gold.
- How the FOMC Cut Short Silver’s Rally in a Single Session.
- Why Gold Holders Can Weather a Quiet Fed.
Popular Topics
Picked from the archive
-
01
 Topics
Why BRICS Nations Are Stockpiling Gold
-
02
Topics
Gold Prices Fall to Seven-Month Low as Geopolitical Fear Fades
-
03
Topics
CPI-Adjusted Silver vs Spot Price: What the Ratio Reveals
-
04
Topics
Shutdown Nears Deadline as Gold Soars 12% in September
-
05
Topics
Gold Price Up 1.5% as ADP, ISM and Beige Book Weigh on Fed
-
06
Topics
Silver vs Gold 2026-2031: 5-Year Investment Outlook
-
07
Topics
US Jobless Claims Jump to 3-Month High, Point to Labor Softening
-
08
Topics
How Fed Pause and Rising PPI Affect Gold Prices