Thursday PCE Drop: How It Affects Gold Prices
Key Takeaways
- PCE is the Federal Reserve’s preferred inflation gauge. It adjusts for consumer substitution and covers a broader set of expenditures than the CPI, making it the indicator most directly tied to Fed rate decisions.
- May PCE is due Thursday, June 25. Core PCE was 3.3% year-over-year in April. A stronger-than-expected reading near or above the Fed’s 3.6% year-end projection would increase pressure for rate hikes and likely weigh on gold. A materially softer print below 3.4% could quickly reduce the market’s odds of a December hike and open a path toward $4,400 per ounce for gold.
- The long-term argument for sound money doesn’t depend on one release. With real yields barely positive, central banks buying gold at a record pace, and Fed projections showing inflation above target through year-end, the structural drivers that make gold a long-term hedge remain intact regardless of one data point.
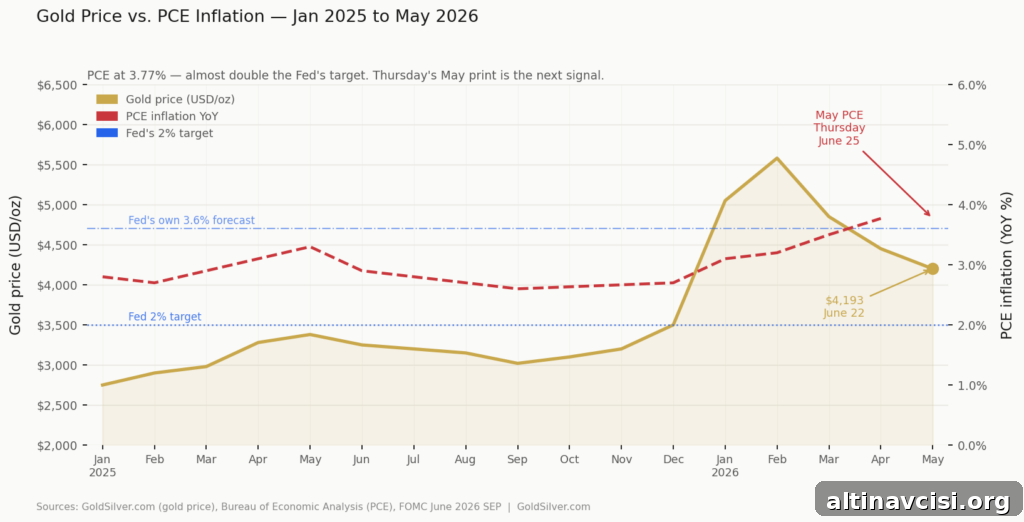
Gold traded around $4,193 on Monday, recovering from a recent low near $4,150. News of a 60-day peace roadmap agreed between the US and Iran in Switzerland pushed oil roughly 2% lower and contributed to silver’s outperformance — silver was near $66.05 after a substantial decline the prior week [GoldSilver, June 22, 2026].
But the most important market event this week is the May PCE report, arriving Thursday morning. That data point will have a direct bearing on monetary expectations and, by extension, precious metals.
What Is PCE Inflation — and Why Does the Fed Use It Instead of CPI?
Most market watchers focus on CPI, the Consumer Price Index, because it dominates headlines. The Federal Reserve, however, relies primarily on the Personal Consumption Expenditures (PCE) price index, published monthly by the Bureau of Economic Analysis. PCE and CPI measure inflation differently, and those differences matter for policy.
CPI uses a fixed consumption basket, while PCE adjusts for how consumers substitute between goods and services when relative prices change. For example, if beef becomes expensive and consumers shift to chicken, PCE reflects that substitution effect. Because of this methodological difference, PCE usually runs 0.3–0.5 percentage points lower than CPI and is often viewed as a closer match to actual household spending patterns.
PCE also includes expenditures not fully captured by CPI, such as healthcare paid on behalf of consumers by insurers and a wider range of financial services. Policymakers favor it because it better represents the economy-wide price pressures the Fed seeks to control.
The April headline PCE came in at 3.77% year-over-year, while core PCE (excluding food and energy) was 3.3% [Bureau of Economic Analysis, April 2026]. The Fed’s target is 2%, yet the Federal Reserve’s June projections put year-end inflation near 3.6% [Federal Reserve Summary of Economic Projections, June 2026]. That projected gap between inflation and the policy target is central to current market dynamics.
The Edge Every Investor Needs
Smarter precious metals investing starts here. The Nuggets Newsletter provides concise market insight, Fed updates, global trends, and educational content to help investors stay informed.
How Does Thursday’s PCE Print Affect Gold Prices?
The May PCE release on Thursday is the most consequential macro event for precious metals this week. PCE informs the Fed’s rate outlook. After the June FOMC meeting, nine of 19 Fed officials indicated at least one rate increase could be appropriate before year-end. That shift toward a more hawkish stance pushed Treasury yields up, strengthened the dollar, and contributed to gold’s decline from levels above $4,400 to a recent low near $4,150. As of June 22, futures markets priced roughly a two-thirds chance of at least one hike by December [CME FedWatch].
Real yields — nominal yields minus inflation — are the direct link between the PCE reading and gold prices. When inflation outpaces nominal yields, real yields fall, eroding the appeal of cash and bonds. Because gold does not pay interest, lower real yields make holding gold relatively more attractive. Conversely, if the Fed signals policy tightening and nominal yields rise faster than inflation, real yields increase and gold typically faces selling pressure.
Currently the 10-year Treasury yield is about 4.48% [US Treasury, June 22, 2026]. With PCE at 3.77%, real yields are only modestly positive. A hotter-than-expected PCE could advance the timeline for hikes and keep pressure on gold, while a softer-than-expected print could quickly shift market expectations and support a rebound in metal prices.
Two plausible scenarios for Thursday:
If May PCE is at or above 3.6%: That would align with the Fed’s own year-end projection and validate the group of policymakers signaling hikes. The dollar would likely remain firm, real yields would stay elevated, and gold would be held down in the lower $4,100–$4,200 range.
If May PCE is below 3.4%: A clear downside surprise would weaken the rate-hike narrative. Markets would likely repriced Fed futures lower, the dollar would soften, real yields would compress, and gold would have a clearer path back toward the $4,400 area seen before the June FOMC meeting.
Why Is the Energy Component Complicating This Week’s Reading?
Energy prices were a dominant driver of May’s CPI, accounting for more than 60% of the monthly increase [Bureau of Labor Statistics, May 2026 CPI Summary]. The Iran situation kept oil elevated through much of May, and that spike feeds directly into PCE’s headline figure. Analysts therefore expect May PCE to be relatively high, with some forecasting figures near 4.1%.
The complication is timing. Brent crude fell about 2% on the June peace news — a meaningful move — but that decline affects June prices more than May’s. Thursday’s report captures May’s activity, so energy relief from the recent oil drop would likely first appear in the June PCE reading released in late July.
As a result, Thursday’s print may still look elevated because it reflects the Iran-driven energy spike. How markets react will depend on whether traders interpret the reading as backward-looking or as guidance for the Fed’s next move.
Why Don’t Long-Term Gold Holders Need to Lose Sleep Over One Number?
It’s important to separate short-term market noise from longer-term structural forces. The Fed’s own projections show core inflation remaining above 2% through 2026. At the same time, national debt sits above $36 trillion — roughly 125% of GDP — creating fiscal pressures that constrain policy options. Those dynamics make it difficult to sustain a prolonged period of materially positive real yields without weighing on growth and debt service costs.
Central banks have been active buyers of gold: official sector purchases reached historically high levels in early 2026, with major economies like China adding to reserves for many consecutive months [World Gold Council, Q1 2026]. Sovereign buyers appear positioned for an environment where inflation proves persistent relative to policy rates, rather than one with long-run, consistently positive real yields. That trend supports gold’s role as a reserve asset and a hedge against purchasing-power erosion.
Put another way: the 7-day yield on a typical money-market fund was about 3.63% recently [Vanguard VMFXX, June 21, 2026] while PCE inflation ran at 3.77%. That implies negative real returns on cash, meaning purchasing power is being quietly eroded even without dramatic market moves. A single data release can move prices, but it does not overturn the broader structural forces at work.
What Should You Watch This Week?
Thursday, June 25: The Bureau of Economic Analysis will publish the May PCE report alongside the final Q1 GDP revision and weekly initial jobless claims. Core PCE — the measure excluding food and energy — is the Fed’s focal point. The prior core reading was 3.3% year-over-year.
Key price levels: Support for gold near $4,100–$4,150. Resistance around $4,400.
The central question: Does June’s emerging energy disinflation already appear in May’s figures, or does Thursday’s print still reflect the Iran-driven oil spike? Answering that will shape gold’s next directional leg.
Stay On Top of Gold & Silver Prices
Receive timely market alerts and concise analysis delivered to your inbox.
SOURCES
1. GoldSilver — Gold & Silver Spot Prices, June 22, 2026
2. Bureau of Labor Statistics — Consumer Price Index Summary, May 2026
3. Bureau of Economic Analysis — PCE Price Index, April 2026
4. Federal Reserve — Summary of Economic Projections, June 2026
5. CME Group — FedWatch Tool, June 22, 2026
6. World Gold Council — Gold Demand Trends Q1 2026
7. US Treasury — 10-Year Constant Maturity Rate, June 22, 2026
8. Vanguard — VMFXX 7-Day SEC Yield, June 21, 2026
9. GoldSilver — Gold Price Outlook June 2026
Disclaimer: This article is for informational purposes only and does not constitute financial or investment advice. Consult a qualified financial adviser before making investment decisions.
You may also like:
- Goldman Sachs Gold Target Cut: What the $1,400 Gap Means
- Gold Price Today, June 19: What Juneteenth Trading Tells You
- Half the Fed Wants a Hike. 45% of Central Banks Are Buying More Gold.
- Silver Hit $69.85 This Morning. Then the FOMC Took It All Back.
- The Fed Went Silent. Gold Holders Don’t Need It to Speak.
- Five Signals That Say Gold’s Correction Is a Reset, Not a Reversal
- The Fed Just Killed Its Rate Roadmap. Here’s What That Means for Gold.
- Gold Holds at $4,347 While Stocks Hit All-Time Highs. Here’s Why.
Popular Topics
Picked from the archive
-
01
 Topics
Why BRICS Nations Are Stockpiling Gold
-
02
Topics
Gold Prices Fall to Seven-Month Low as Geopolitical Fear Fades
-
03
Topics
CPI-Adjusted Silver vs Spot Price: What the Ratio Reveals
-
04
Topics
Shutdown Nears Deadline as Gold Soars 12% in September
-
05
Topics
Gold Price Up 1.5% as ADP, ISM and Beige Book Weigh on Fed
-
06
Topics
Silver vs Gold 2026-2031: 5-Year Investment Outlook
-
07
Topics
US Jobless Claims Jump to 3-Month High, Point to Labor Softening
-
08
Topics
How Fed Pause and Rising PPI Affect Gold Prices