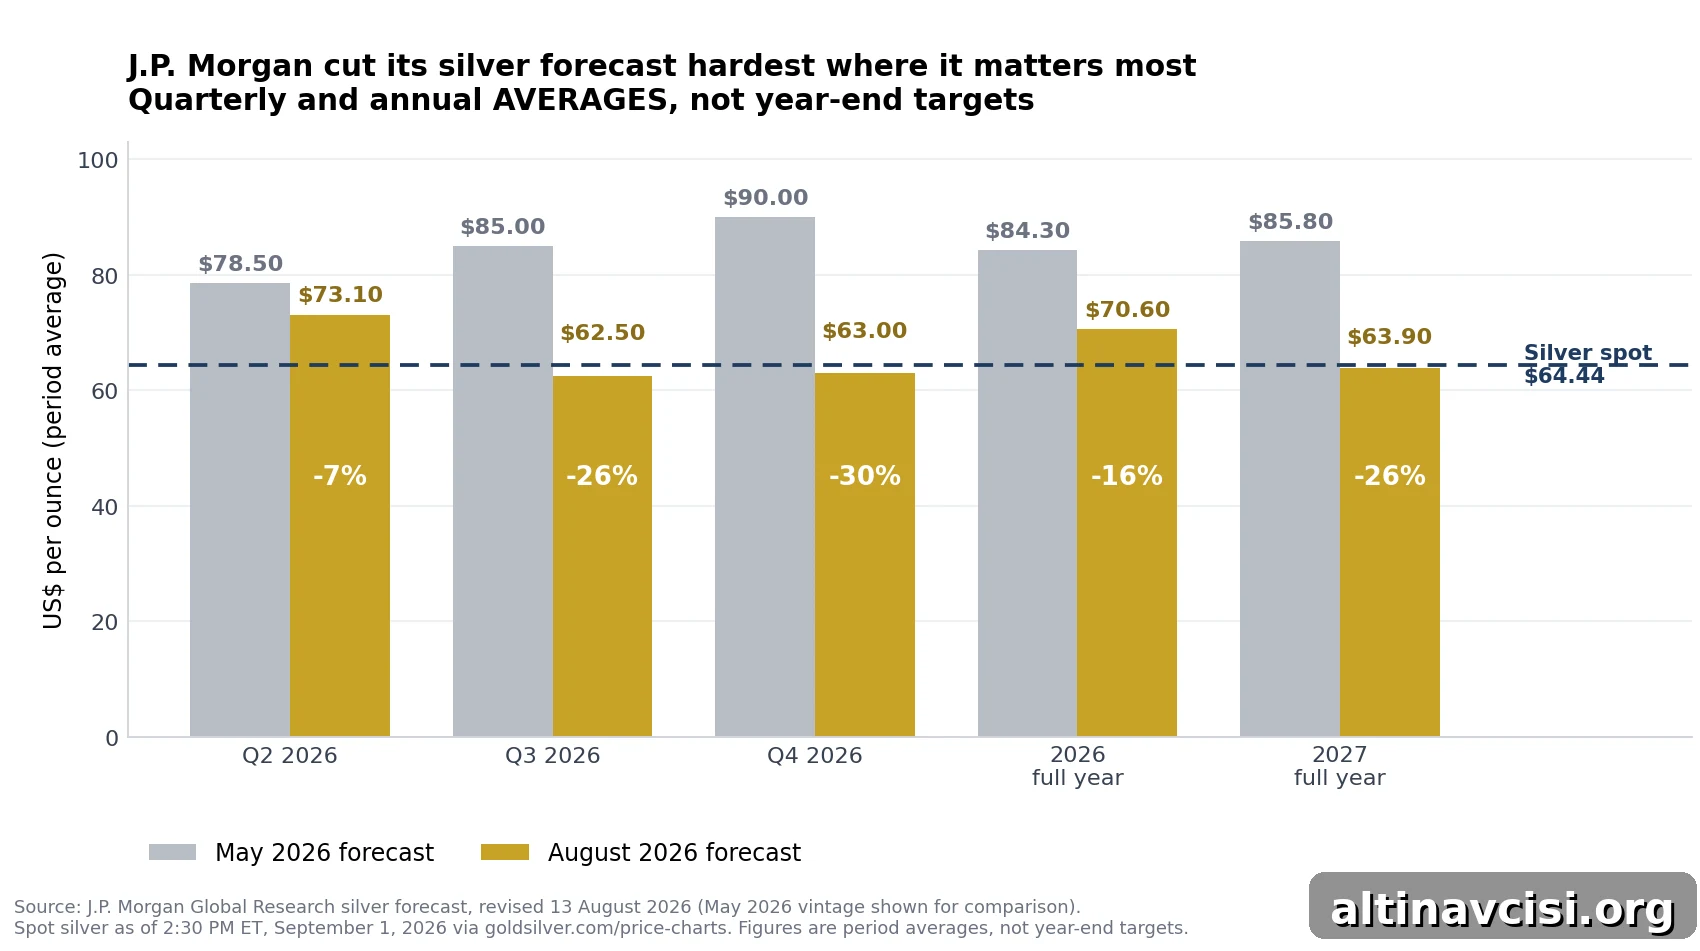
J.P. Morgan trimmed its fourth-quarter silver forecast from $90 to $63. That revision had little to do with interest rates — it was driven largely by changes in solar-panel demand.
Silver traded at $64.44 per ounce as of 2:30 PM ET on Tuesday, September 1, 2026. Gold was at $4,336.46. That puts the gold‑to‑silver ratio at 67.3 — a useful lens for comparing forecasts and positioning.
On August 13, 2026, J.P. Morgan Global Research published a revised set of price projections that cut its fourth-quarter 2026 silver average from $90.00 to $63.00 per ounce. Unusually, the revised target landed at about the same level as the market price rather than lagging behind it.
What changed in J.P. Morgan’s silver forecast?
J.P. Morgan’s August 13, 2026 table shows meaningful downward revisions across the quarters and full-year averages. The largest cut was to Q4, where the bank trimmed its average from $90 to $63 per ounce — a 30% reduction. The full-year 2026 average was lowered from $84.30 to $70.60 (−16%), and the 2027 full-year average fell from $85.80 to $63.90 (−26%).
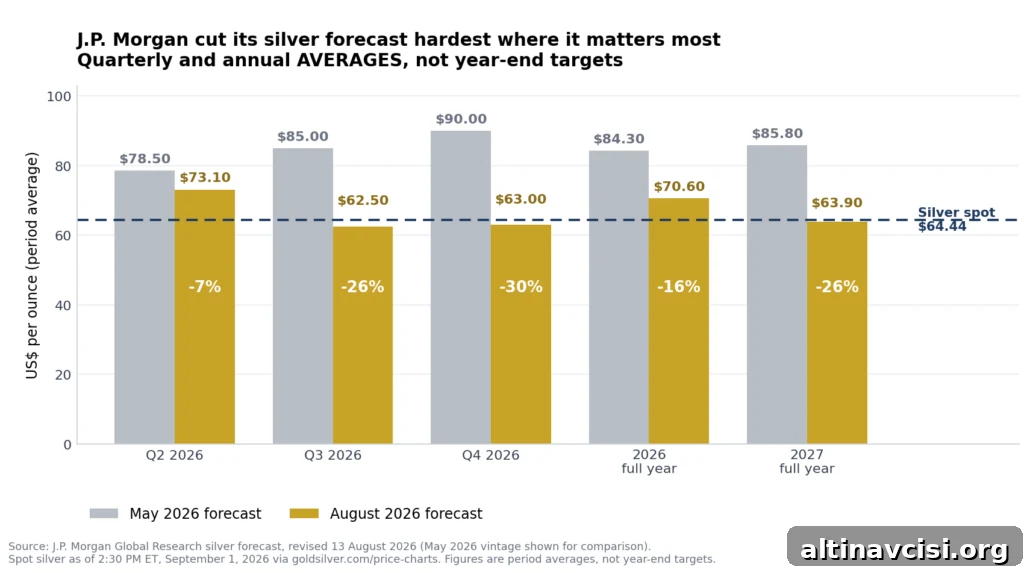
| Period | May 2026 | August 2026 | Change |
|---|---|---|---|
| Q2 2026 | $78.50 | $73.10 | −7% |
| Q3 2026 | $85.00 | $62.50 | −26% |
| Q4 2026 | $90.00 | $63.00 | −30% |
| 2026 full year | $84.30 | $70.60 | −16% |
| 2027 full year | $85.80 | $63.90 | −26% |
All figures are quarterly and annual averages, not year‑end targets. Source: J.P. Morgan Global Research, August 13, 2026.
Why does the basis label matter?
The distinction between an average and a point-in-time price matters. A 2026 average of $70.60 looks higher than current spot, but silver already averaged $83.70 in Q1. Much of the year’s average is behind us, so the most forward-looking figure is the Q4 average of $63.00. The shape of the revisions — a modest Q2 cut but much larger cuts in later quarters — shows J.P. Morgan is changing its view of future demand rather than simply marking past prices to market.
The table shows one institution’s primary-source revision. Many circulating forecasts are recycled or aggregated; relying on the original research avoids double‑counting and misattributed figures.
If not the Fed, what caused the cut?
Higher interest rates do matter — they raise the opportunity cost of holding non‑yielding assets — but they don’t fully explain J.P. Morgan’s 30% cut to the Q4 average. Gregory Shearer, head of Base and Precious Metals Strategy at J.P. Morgan, points to a decline in silver demand from the solar industry as the primary driver.
Between the open and 2:30 PM ET on September 1, silver fell about 3.17% while gold fell about 2.50% on the same news. Gold’s smaller drop reflects its structural buyer: central banks accumulate gold as a reserve asset, while they do not accumulate silver. That structural bid cushions gold during rate moves; silver has less of that support.
How big is the solar demand decline?
Shearer expects photovoltaic (PV) silver demand to decline roughly 30% this year — about 60 million ounces. Silver in PV cells serves as a conductive paste, a cost input manufacturers can reduce or substitute when prices rise. This “thrifting” has accelerated as silver prices climbed.
Two policy moves amplified the shift. Chinese buyers front‑loaded imports before an April 1 removal of an export VAT rebate on photovoltaic products and have been running down those inventories since. India increased effective import duties on gold and silver to 15% on May 13, 2026, reducing imports there as well. Those policy shifts reduced immediate industrial demand for silver.
Importantly, solar installations can still increase even while silver demand per panel falls: more panels installed but less silver used per panel. So headlines about record deployments say nothing definitive about silver demand unless you also know loading rates and substitution trends.
Is the demand loss bigger than the shortage?
The structural supply‑deficit story remains real. The World Silver Survey 2026 projected a 2026 market deficit of 46.3 million ounces — the sixth consecutive annual shortfall. But Shearer’s expected 60 million ounce reduction in solar demand exceeds that projected deficit in size.
You cannot simply subtract one headline from the other. The Silver Institute’s deficit forecast already assumes some decline in PV demand because thrifting and substitution have been underway. Still, the comparison highlights a critical point: institutions are not debating whether solar demand falls — they are debating by how much. That single variable can determine whether a deficit remains or evaporates.
How can the disagreement be resolved?
This question is testable. Watch Chinese and Indian import statistics, published panel‑loading figures, and disclosure from major module manufacturers. Those data sources will show whether thrifting continues at scale or if policy changes and shifting inventories restore industrial demand.
What does the gold-silver ratio say about silver?
Converting price forecasts into a gold‑to‑silver ratio focuses attention on relative performance. The ratio, which measures how many ounces of silver buy one ounce of gold, was about 67.3 on September 1, 2026. In late January, when silver peaked, the ratio briefly dropped below 45.
Long‑run averages vary by methodology, but J.P. Morgan cites a modern-era average roughly between 55 and 70. At 67.3, silver sits near the top of that range. J.P. Morgan expects the ratio to widen toward 70 in H2 2026 and around 75 in 2027 — a forecast of silver underperforming gold rather than a collapse of silver.
Bullish silver targets typically rest on ratio compression: a shift in buyers from industrial users to monetary or investment demand that narrows the gap with gold. Some high targets are arithmetic exercises that assume a compressed ratio multiplied by the gold price rather than a demonstrated change in demand composition.
Is silver’s next buyer monetary or industrial?
That question decides silver’s path. If the marginal buyer becomes monetary — investors, ETFs with allocated metal, central banks — the ratio can compress and silver outperforms. If the marginal buyer remains industrial and manufacturers continue to remove silver from products, the ratio will widen and silver will lag gold.
About 50–55% of annual silver demand is industrial (electronics, solar, EVs, medical). That dual nature explains why silver’s price forecasts are wider and more uncertain than gold’s.
What could break the bearish case?
Two developments could alter the current bearish view:
- Policy reversal in India. The 15% import duty introduced in May 2026 is under review. If it is cut back, one of the demand‑reducing shocks would unwind and imports could recover.
- Shift in buyer composition. If physical investment demand — coins and bars — rises enough to absorb metal released by industrial thrifting, the market’s effective float changes. Investors who hold metal rather than claims on metal reduce available supply and can push prices higher in a squeeze scenario.
Why does storage matter?
Silver consumed in industry — for example, in a solar panel — is effectively removed from liquid inventories. Silver bought as bars or coins remains in circulation and can be stored, traded, or hoarded. If the marginal buyer shifts from manufacturers to investors, the market’s available float depends more on storage and allocation terms than on mine production alone. Past episodes, such as low unencumbered availability in London vaults, show how physical availability can tighten even when the metal exists somewhere.
Is every form of silver exposure identical?
No. Holding an ETF gives price exposure but may not guarantee the right to physical delivery. Allocated, vaulted silver that you can take delivery of behaves differently in a squeeze than an unallocated claim. If you act on a deficit thesis, how you store silver matters: location, allocation, and access terms all affect the real economics of possession.
So what is the silver price prediction for 2026?
Forecasts vary widely. Rather than a single number, the debate is about structure:
- Base case: The most recently revised major forecast expects silver to average around $63 in Q4 2026, with the gold‑silver ratio widening toward 70 and then 75. Silver would underperform gold.
- Bull case: Requires a material shift in the marginal buyer from industrial to monetary, compressing the ratio substantially and pushing silver much higher.
- Deciding factor: The size of the decline in solar demand and whether policy or inventory changes reverse that trend.
- Watch: Chinese and Indian import data, module loading disclosures, and any reversal of India’s import duty.
Remember that forecasts represent current views, not certainties. In May one research team expected a Q4 average near $90; by August that same team projected $63. Treat every number as a belief today, not a fact about December.
The Knowledge That Changes Everything

Two essential guides — free. Understand why gold matters and how fiat currencies lose purchasing power over time.
Stay On Top of Gold & Silver Prices
Get important market alerts sent straight to your inbox.
People Also Asked
The recently revised major-bank view is roughly flat to slightly lower. J.P. Morgan projects a Q4 average around $63 compared with spot near $64.44. The upside scenario requires investment demand to outweigh industrial thrifting and substitute technologies.
Mainly because of expected demand destruction in solar panels: thrifting and substitution reduce silver loading per module. Policy changes in China and India accelerated the decline. Higher interest rates were a secondary factor.
No. Major surveys project a 2026 deficit, but the magnitude depends on how much industrial demand — especially in solar — declines. If thrifting is large enough, the deficit could shrink or disappear.
At about 67 it sits above January’s sub‑45 reading. J.P. Morgan expects the ratio to widen toward 70 in late 2026 and around 75 in 2027, implying silver underperformance relative to gold.
Roughly 50–55% of annual silver demand is industrial — electronics, solar, EVs, and medical uses — which gives silver a dual monetary and commodity profile and increases forecast uncertainty.
Yes. Physical allocation and storage terms matter in a squeeze. A claim on metal is not identical to allocated, vaulted metal you can take delivery of.
SOURCES
1. J.P. Morgan Global Research — The Path for Silver Prices in 2026 and 2027 (August 13, 2026)
2. Silver Institute / Metals Focus — Global Silver Investment to Remain Strong in 2026 Against the Backdrop of a Sixth Consecutive Annual Market Deficit (2026)
3. Bloomberg, CNBC, and industry reports referenced for policy and market developments cited above.
Disclaimer: This article is informational and does not constitute investment advice. Past performance does not guarantee future results. Consult a qualified financial advisor before making investment decisions.
You May Also Like:
- Will Gold Go Down for the Rest of 2026? Six Banks Cut Their Targets
- SLV Holds Your Silver. It Just Can’t Give It Back to You.
- What Are the IRS Rules for a Precious Metals IRA in 2026?
- Why Your Pension Can Own Gold and Your 401(k) Still Can’t