
Gold’s speculative crowd is the largest it has been in 60 weeks — but that increase did not come from fresh buyers. In the Commodity Futures Trading Commission’s Commitments of Traders report for positions as of August 11, non-commercial net long positions in gold reached 54.44% of open interest. At the same time, gross long positions remained below the 60-week median. In short, the apparent crowd grew because sellers left the market rather than because speculators aggressively bought.
As of Friday, August 21, 2026, Gold trades at $4,591.45, up 1.60% on the day and 4.91% for the week. Silver sits at $69.16, up 1.53% on the day and 6.89% for the week. Why did silver rise faster than gold this week? The positioning data help explain the difference.
Key takeaways
- Silver outpaced gold this week, yet silver’s speculative crowd was modest by recent standards — ranking 47th of the last 60 weeks on August 11. Gold’s net speculative share hit a 60-week high at 54.44% of open interest.
- Gold’s 60-week high reflects departing shorts rather than extraordinary buying. Gross longs ranked 33rd of 60 weeks, while gross shorts were unusually thin at 64% of their 60-week median versus silver’s shorts at 87% of median.
- Positioning metrics describe leverage in the futures market, not physical ownership. Demand and supply in physical metal are managed through separate channels that do not appear in the CFTC data.
Why gold’s 60-week high is not necessarily a buy signal
First, understand the metric: crowding is net speculative length divided by open interest, not raw contract counts. Open interest changes over time, so the ratio normalizes for market size. The figures referenced here reflect positions held on August 11 and were published in the CFTC report released later.
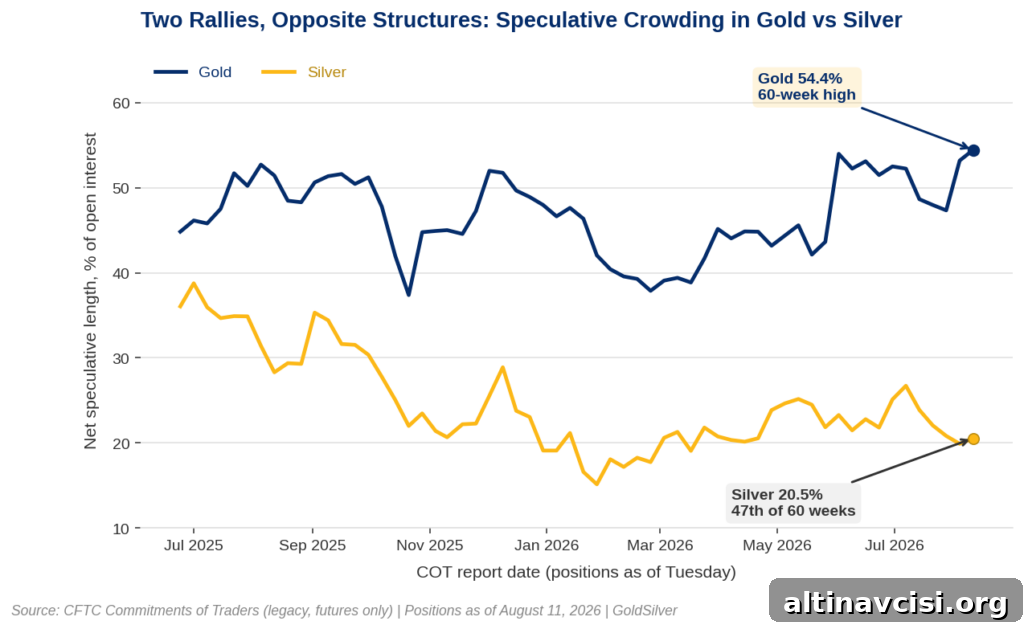
On August 11, gold’s non-commercial net long position totaled 217,940 contracts and open interest was 400,309 contracts, yielding the 54.44% reading — the highest in the 60-week sample. The peak is marginal, however; it only led the next-highest reading (June 2) by 0.45 percentage points, so it is not evidence of a structural regime shift.
Looking deeper, gross longs were 250,936 contracts, slightly below the 60-week median of 253,558 and ranking 33rd of 60 weeks. Speculators were not unusually long. Instead, gross shorts were thin: 32,996 contracts against a 60-week median of 51,716, or about 64% of normal. In other words, the net long share rose mainly because short positions were cut, not because a wave of new long positions was added.
What is the short-covering cushion?
A short position is closed by buying, so gross short open interest represents a pool of standing demand that automatically provides bids if prices fall. That mechanism cushions price declines. When gross shorts thin relative to their historical norm, the automatic bid weakens. Consequently, price declines can become disorderly liquidations rather than orderly repricing. Importantly, this is a feature of the paper futures market and does not indicate any change to the physical supply of metal.
Why is silver rising while speculators largely stay on the sidelines?
Silver’s positioning presents a near-opposite picture. On August 11, silver’s net speculative length was 20.54% of open interest, ranking 47th of 60 weeks and about 53% of its recent peak of 38.76% (set the week of July 1, 2025). Silver’s gross longs ranked 34th of 60 — roughly mid-pack. The key difference, again, is the short side: silver’s gross shorts were 15,629 contracts versus a 60-week median of 17,932, or about 87% of normal. That means silver’s short-covering cushion was relatively more intact than gold’s.
Silver outperformed gold by nearly two percentage points this week, which is not unusual. Silver markets are smaller and more volatile and therefore tend to move farther in both directions. What matters from a risk perspective is that silver advanced with less one-sided leverage in the futures book, making the rally mechanically less fragile than gold’s — at least as of the August 11 snapshot.
A cautionary note: thin positioning is not inherently bullish. It can indicate that professionals do not trust the move and can persist for long periods. Positioning helps assess fragility and leverage risk, not to forecast price direction with certainty.
What this means for owners of physical metal
Positioning data describe the paper futures market, not physical holdings. Two important demand channels sit outside the Commitments of Traders data: physically backed exchange-traded funds and industrial and investment demand for actual ounces. For example, the iShares Silver Trust reported holding 15,275.59 tonnes on August 19, and the Silver Institute’s World Silver Survey 2026 noted significant industrial demand that has contributed to consecutive deficits. None of these physical flows appears in the CFTC positioning report.
When leveraged positions unwind, the quoted futures price can move sharply without any corresponding transfer of metal. Owners of allocated physical metal do not face margin calls and are not forced sellers; the price can fall while the ounces remain in storage. That distinction matters for anyone comparing paper exposure to outright ownership.
Why these two rallies are not the same trade
Both metals benefited from a softer dollar and easing yields, which explains direction but not structural resilience. Beneath that common headline, the rallies have different mechanics: gold’s advance sat on a much thinner short book (about 64% of normal), while silver’s short cushion remained nearer to historical levels. That difference means gold may have less mechanical support if traders reverse, while silver’s futures structure offered comparatively more standing demand to absorb declines.
Watch the gross short count when new CFTC data arrive — for example, the report for positions as of August 18 is released at 3:30 p.m. Eastern. In these episodes, gross shorts are often the more informative number for gauging market fragility than net length alone.
Frequently asked questions
The Commitments of Traders report is a weekly disclosure from the Commodity Futures Trading Commission that shows how open interest in futures markets is distributed across trader categories. It is released each Friday and reflects positions held the previous Tuesday, so the data are always several days old on publication.
Open interest changes over time, so dividing net speculative length by open interest normalizes for market size and reveals how one-sided the market is. The same contract count can mean very different levels of crowding in markets of different total size.
Gross shorts are the total short contracts outstanding before netting with longs. Since closing a short requires buying, gross shorts represent a standing pool of potential demand that cushions price declines. When gross shorts are thin, that cushion weakens and declines can amplify through forced unwinds.
Not necessarily. Light positioning indicates lower leverage and, therefore, less mechanical vulnerability, but it can also reflect skepticism among professional traders. Positioning helps assess fragility rather than serving as a reliable directional forecast.
Because futures positioning is only one channel among many. Physically backed ETFs, industrial buyers, and other physical demand do not appear in the CFTC report and can drive price moves independently of speculative positioning.
The futures benchmark price can fall sharply during leveraged unwinds, but holders of allocated physical metal do not face margin calls and are not forced to sell. The quoted price may change while the physical ounces remain intact.
SOURCES
1. U.S. Commodity Futures Trading Commission — Commitments of Traders, positions as of August 11, 2026, released August 14, 2026
2. iShares — iShares Silver Trust (SLV) fund disclosure, holdings as of August 19, 2026
3. The Silver Institute — World Silver Survey 2026, published April 15, 2026
4. GoldSilver — Live gold price chart, accessed August 21, 2026
5. GoldSilver — Live silver price chart, accessed August 21, 2026
Disclaimer: This article is for informational purposes only and does not constitute investment advice. Past performance is not indicative of future results. Consult a qualified financial advisor before making investment decisions.
You May Also Like:
- Gold Hit a Three-Month High. Silver Hit a Two-Month High. One Story Connects Them.
- The National Debt Hit $40 Trillion. Jefferies Just Turned Bullish on Gold.
- Gold Fell and Silver Rose on the Same Report. Here Is the Mechanism.
- Trump Declared Economic War on Iran. Gold Barely Blinked. Here’s Why.
- Gold’s Pullback Isn’t About ETFs. It’s About a Treasury Buyback.
- The Fed Just Confirmed a 9-3 Split. Then It Said Something Bigger.