
Investors withdrew $603 million from the world’s largest gold ETF this week — but almost none of that money actually left the gold market.
As of today, gold trades near $4,347 an ounce, up from Tuesday’s open at $4,294 as markets await the Federal Reserve’s decision. Silver sits around $64.54 per ounce. Live price charts are commonly available from market-data providers for real-time tracking.
Key Takeaways:
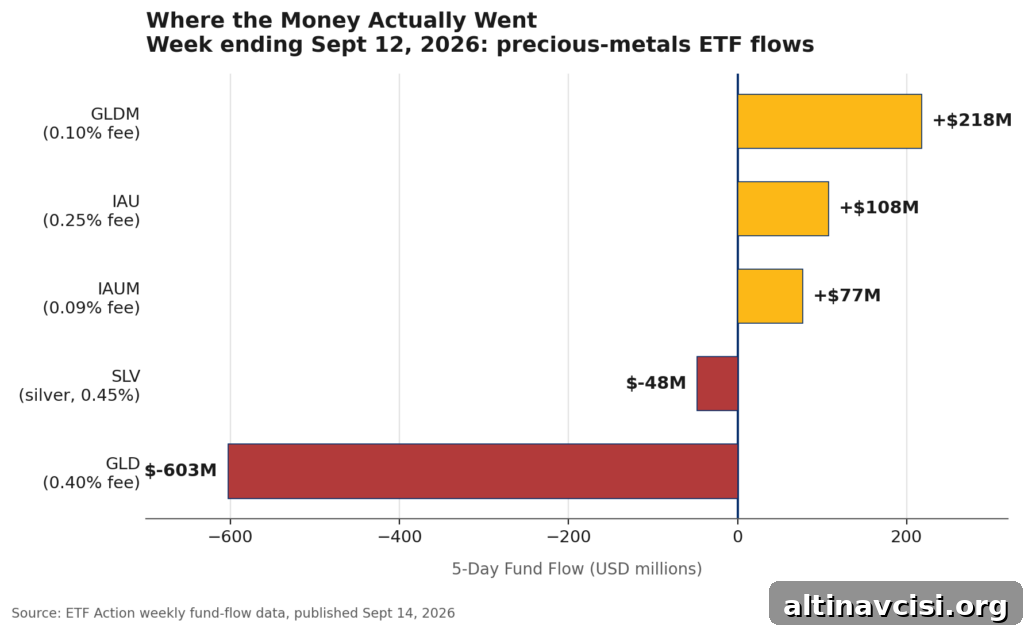
- Gold ETFs overall saw only a modest net outflow this week, driven largely by redemptions in one large fund: SPDR Gold Shares (GLD) shed $603 million. At the same time, three lower-cost funds that provide the same price exposure (GLDM, IAU, IAUM) attracted a combined $403 million.
- August was a major month for gold ETF inflows. According to industry reporting, global gold ETF inflows totaled roughly $18 billion in dollar terms — one of the largest monthly increases on record. Total holdings hit a record in tonnes and assets under management climbed near $615 billion.
- All of the major gold ETFs are similar in structure: they represent claims on a trust that holds bullion. They do not automatically translate to allocated bars held in your personal name. This week’s flows were an intra-system rotation rather than a shift out of paper gold into physical possession.
Why Did $603 Million Leave the World’s Biggest Gold ETF?
Weekly fund-flow data show that SPDR Gold Shares (GLD), the largest gold ETF, experienced roughly $603 million in net redemptions during the most recent reporting week. At first glance, that headline number looks like investors are fleeing gold. But the full story is different once you consider flows across the broader set of gold ETFs.
During the same period, several lower-cost competitors gained assets: SPDR Gold MiniShares (GLDM) received about $218 million, iShares Gold Trust (IAU) took in around $108 million, and iShares Gold Trust Micro (IAUM) added roughly $77 million. Together those funds saw about $403 million of inflows. Net of inflows and outflows across all precious-metals ETFs, the category reported only a modest net outflow for the week. In short, money largely moved between funds that provide the same exposure to the gold price rather than exiting the asset class.
Where Did the Money Actually Go?
The driver is straightforward: fee arbitrage. Different ETFs charge different annual expense ratios. For example, an older, established fund may charge roughly 0.40% per year, while several newer or “mini” share classes charge between 0.09% and 0.25%. All these funds offer the same fundamental exposure — they are backed by bullion held in trust and they issue shares that track the price of gold.
An investor moving a large position from a higher-fee fund to a lower-fee fund is not changing their view on gold’s price. They are simply reducing ongoing costs. Consider a hypothetical $10 million position: the difference between a 0.40% expense ratio and a 0.09% expense ratio amounts to tens of thousands of dollars per year. Scaled across institutional allocations and large accounts, the savings become material and explain why hundreds of millions can rotate from one fund to another in a short period.
This rotation happened against a backdrop of strong gold ETF demand in August, when global holdings and dollar inflows reached record or near-record levels. That context reinforces the point that investors broadly remain bullish on gold, even as they switch wrappers for lower cost.
Does Owning a Gold ETF Mean You Own Gold?
All of these popular gold ETFs are the same type of instrument in legal terms: they are securities representing a pro rata claim on a trust that holds metal. None directly gives you a specific allocated bar in your personal name. When shares are redeemed, the trust typically sells bullion into the market to meet redemption obligations. The transactions occur inside the financial plumbing that supports paper gold.
That distinction matters. Moving money from a high-fee ETF to a low-fee ETF is a sensible cost-saving move, but it is not the same as taking possession of physical metal in allocated storage. Two decades after the first major gold ETF launched, the market now efficiently arbitrages fees at scale. Many investors treat ETF shares as equivalent to owning physical bullion, yet the mechanics and legal outcomes differ. Understanding what the product actually delivers — exposure to the gold price, convenience, liquidity, and custody inside a trust — should inform any investor’s choice.
What Should Gold ETF Investors Watch Next?
Watch weekly fund-flow reports to see whether the shift toward lower-cost share classes continues after the Fed decision and any resulting rate clarity. Weekly data providers offer timely granularity that monthly industry reports do not, and fund-level disclosures from issuers can show daily changes in holdings. For investors, the key signals to monitor are fund expense ratios, daily holdings reports from large issuers, and net flows across competing ETFs — all of which indicate whether money is rotating inside the paper-gold ecosystem or leaving it entirely.
Stay On Top of Gold & Silver Prices
Sign up for alerts to receive key market updates and price moves by email.
SOURCES
1. ETF Action – report on fund flows and weekly data (September 14, 2026).
2. World Gold Council – monthly gold ETF holdings and flows report (September 9, 2026).
3. State Street Global Advisors – fund disclosures for SPDR Gold Shares and SPDR Gold MiniShares (public filings and daily holdings).
4. BlackRock iShares – fund pages and disclosures for IAU and IAUM (public documents and regulatory filings).
5. Market-data providers – live gold and silver spot prices and historical charts.
Disclaimer: This article is informational only and does not constitute investment advice. Always consult a qualified financial advisor before making investment decisions.
You May Also Like:
- Texas Just Made Gold Legal Money. Four More Non-Fed Stories Followed.
- Silver Is Outperforming Gold by a Third This Morning.
- The Fed Votes Wednesday. Gold’s Other Vote Lands Friday.
- The Fed Vote Is Already Priced In. These Five Things Aren’t.
- The 10-Year Yield Just Hit an 18-Year High. Gold Isn’t Falling For It.
- Gold Fell 1.62% Today. Gold Miners Didn’t. Here’s the Math.